16. Regression Analysis (प्रतीगमन या प्रत्यागमन विश्लेषण)
Regression Analysis
(प्रतीगमन या प्रत्यागमन विश्लेषण)

परिचय
‘प्रतीपगमन’ (Regression) शब्द का अर्थ ‘पीछे लौटना’ अथवा ‘वापस आना’ (to regress or return back) है। इस शब्द का सर्वप्रथम प्रयोग 1877 में सर फ्रांसिस गाल्टन (Sir Francis Galton) ने अपने शोध लेख ‘पैतृक ऊँचाई में मध्यमता की ओर प्रतीपगमन’ (Regression towards mediocrity in hereditary stature) में किया था।
प्रत्यागमन विश्लेषण (Regression Analysis) सांख्यिकी का एक अत्यंत महत्वपूर्ण विश्लेषणात्मक उपकरण है, जिसका उपयोग दो या दो से अधिक चर (Variables) के बीच संबंधों का अध्ययन करने के लिए किया जाता है। यह न केवल चर के बीच संबंधों की दिशा एवं ताकत को मापता है, बल्कि इस आधार पर भविष्य के मूल्यों का पूर्वानुमान (Prediction) भी करता है। इसीलिए इसे पूर्वानुमान के लिए सबसे प्रभावी सांख्यिकीय विधियों में से एक माना जाता है।
प्रत्यागमन विश्लेषण मुख्य रूप से निर्भर चर (Dependent Variable) और स्वतंत्र चर (Independent Variable) के बीच संबंधों पर आधारित होता है। उदाहरण के लिए, यदि हम जानना चाहें कि किसी छात्र के परीक्षा-अंक उसकी पढ़ाई के घंटों पर कैसे निर्भर करते हैं, तो हम Regression Analysis का उपयोग करेंगे।
प्रत्यागमन विश्लेषण की परिभाषा
“Regression उस सांख्यिकीय तकनीक को कहते हैं जिसके द्वारा दो चर के बीच मात्रात्मक संबंध स्थापित किया जाता है और उसके आधार पर संबंधित चर के मूल्यों का अनुमान लगाया जाता है।”
सक्षेप में-
Regression वह पद्धति है जिसमें हम एक चर के माध्यम से दूसरे चर के मूल्यों का अनुमान लगाते हैं।
Regression Analysis की आवश्यकता और उपयोगिता
(i) पूर्वानुमान (Prediction):-
Regression Analysis की आवश्यकता और उपयोगिता पूर्वानुमान में इसलिए है कि यह चर (variables) के बीच संबंध स्थापित कर भविष्य के मानों का अनुमान लगाने, रुझान पहचानने और निर्णय-निर्धारण में सहायता करता है।
बिक्री, उत्पादन, मांग, तापमान, GDP, जनसंख्या आदि का भविष्य अनुमान लगाने में उपयोगी।
(ii) निर्णय-निर्माण (Decision Making):-
Regression Analysis की आवश्यकता निर्णय-निर्माण में इसलिए होती है क्योंकि यह भविष्य के रुझानों का अनुमान, चर-परिवर्तनशीलताओं का प्रभाव और नीतिगत या व्यावसायिक विकल्पों की सटीकता को बढ़ाता है।
(iv) चर-संबंधों का अध्ययन:-
Regression Analysis की आवश्यकता चर-संबंधों को मात्रात्मक रूप से समझने, पूर्वानुमान बनाने, कारण-प्रभाव दिशा पहचानने और विभिन्न स्वतंत्र चरों का आश्रित चर पर प्रभाव मापने में होती है;
(v) प्रत्यक्ष एवं अप्रत्यक्ष प्रभावों की माप
जैसे- आय का उपभोग पर प्रभाव, शिक्षा का आय पर प्रभाव।
(vi) वैज्ञानिक व सामाजिक अनुसंधान में उपयोग
मनोविज्ञान, जनसांख्यिकी, भौतिकी, जीवविज्ञान, भूगोल आदि में व्यापक उपयोग।
Regression के प्रकार (Types of Regression Analysis)
1. Simple Regression (सरल प्रत्यागमन)
जब एक स्वतंत्र चर और एक निर्भर चर के बीच संबंध स्थापित किया जाता है।
उदा.—उपभोग (Y) = f (आय X)
Regression Equation: Y = a+bX
2. Multiple Regression (बहु-प्रत्यागमन)
जब अनेक स्वतंत्र चर किसी एक निर्भर चर को प्रभावित करते हैं।
उदा.- आय (Y) = शिक्षा (X₁) + अनुभव (X₂) + कौशल (X₃)
Equation: Y=a+b1X1+b2X2+b3X3…….
3. Linear Regression (रेखीय प्रत्यागमन)
जहाँ निर्भर चर और स्वतंत्र चर के बीच संबंध सीधी रेखा के रूप में हो।
Y = a+bX
Regression Line (प्रत्यागमन रेखा)
Regression Analysis का मुख्य उद्देश्य एक ऐसी रेखा खोजना होता है जो स्वतंत्र चर और निर्भर चर के बीच न्यूनतम त्रुटि (Minimum Error) के साथ संबंध दर्शाए।
Regression Coefficient (प्रत्यागमन गुणांक)
Regression coefficient (b) यह बताता है कि स्वतंत्र चर में एक इकाई परिवर्तन होने पर निर्भर चर में कितना परिवर्तन होगा।
उदाहरण:
यदि b = 0.8
तो X में 1 इकाई वृद्धि होने पर Y में 0.8 इकाई वृद्धि होगी।
Regression coefficient के गुण:
⇒ b का मान धनात्मक (+) या ऋणात्मक (–) दोनों हो सकता है।
⇒ b = 0 मतलब दोनों चरों में कोई संबंध नहीं।
⇒ यदि दोनों b (bxy और byx) धनात्मक हों = सीधा संबंध।
⇒ यदि दोनों b ऋणात्मक हों = व्युत्क्रम संबंध।
Regression Analysis का एक सरल उदाहरण
मान लीजिए किसी छात्र ने पढ़ाई (X) के घंटे और परीक्षा-अंक (Y) का विवरण दिया:
| X (घंटे) | Y (अंक) |
| 2 | 40 |
| 3 | 50 |
| 4 | 60 |
| 5 | 70 |
Regression Equation:
Y=a+bX
यदि गणना से प्राप्त हो:
a = 20, b = 10
तो समीकरण होगा:
Y = 20+10X
यदि X = 6 घंटे पढ़ाई →
Y = 20+10(6)=80
अर्थात छात्र अनुमानतः 80 अंक प्राप्त करेगा।
Correlation और Regression में अंतर
| बिंदु | Correlation | Regression |
| उद्देश्य | संबंध मापना | पूर्वानुमान करना |
| संबंध दिशा | केवल दिशा/मजबूती बताता है | आश्रित व स्वतंत्र का संबंध बताता है |
| Variables | कोई dependent नहीं | Y dependent, X independent |
| मान सीमा | -1 से +1 | कोई भी मान |
| परिणाम | r (सहसंबंध गुणांक) | Y = a + bX (प्रतिगमन समीकरण) |
| उपयोग | संबंध की मजबूती | Prediction (पूर्वानुमान) |
प्रत्यागमन विश्लेषण एक अत्यंत प्रभावी एवं वैज्ञानिक सांख्यिकीय तकनीक है जो विभिन्न क्षेत्रों में भविष्य के अनुमान लगाने, संबंधों को समझने और निर्णय लेने में महत्वपूर्ण भूमिका निभाती है। यह केवल दो चरों के बीच संबंधों का मात्रात्मक विश्लेषण ही नहीं करता, बल्कि इसके आधार पर व्यावहारिक समाधान भी प्रदान करता है।
सटीक एवं विश्वसनीय आंकड़ों के साथ उपयोग करने पर Regression Analysis शोध, अर्थव्यवस्था, विज्ञान, समाजशास्त्र, नीति-निर्माण और व्यावसायिक क्षेत्रों में अत्यंत उपयोगी सिद्ध होता है।
नोट: गाल्टन ने लगभग एक सहस्र पिताओं तथा पुत्रो की ऊँचाइयों का अन्वेषण करके यह ज्ञात किया कि “लम्बे पिताओं के पुत्र भी लम्बे होते है, तथा छोटे पिताओं के पुत्र भी छोटे होते हैं, परन्तु लम्बे पिताओं के पुत्री की औसत ऊँचाई उनके पिताओं की ऊँचाई की औसत से कम होती है तथा छोटे पिताओं के पुत्रों की औसत ऊँचाई उनके पिताओं की ऊँचाई की औसत से अधिक होती है।”
गाल्टन ने मानव जाति में सामान्य ऊँचाई (normal height) की ओर लौटने की प्रवृत्ति को प्रतीपगमन को संज्ञा दी है।
उत्तर लिखने का दूसरा तरीका
Regression Analysis
Introduction:
The mutual relationship between two Series is measured with the help of Correlation. Under correlation the direction and magnitude of the relationship between two variables is measured. But it is not possible to make the best estimate of the value of a dependent Variable on the basis of the given value of the Independent Variable by correlation analysis.
Therefor, to make the best estimates and future estimation, the Study of regression analysis is very Important useful.
Meaning:
Regression is the Study of the nature of relationship between that one may be able to Predict the Unknown value of one variable for a known value of another Variable.
In regression, one variable is considered as an independent Variable and another Variable is taken as dependent Variable. with the help of regression, possible values of the dependent Variable are estimated on the basis of values of the independent variable.
for example demand and price.
On the basis of this relationship between demand and price probable Value of demand can be estimated Corresponding to the different Values of place.
⇒ Regression Analysis is the technique for measuring or estimating the relationship among Variables.
⇒ Regression Analysis provides estimates of Values of the dependent Variable From the Values of the independent Variable.
⇒ The device used to accomplish this estimation procedure is the regression line.
⇒ The regression line describes the average relationship existing between x and y.
Exmple-
| x | y |
| 4 | 100 |
| 7 | 92 |
| 15 | 90 |
| 18 | 82 |
| 20 | 79 |
| 25 | 74 |
| 28 | 68 |
| . | . |
| . | . |
| 35 | ? (here, x given, y=?) |
| . | . |
| . | . |
| ? (here, y given, x=?) | 20 |
Difference Between Correlation and Regression
| Correlation Analysis | Regression Analysis |
| 1. Correlation coefficient is a measure of degree of covariability between x and y. | 1. Objective of regression analysis is to Study the nature of relationship between Variables. |
| 2. In Correlation analysis we can not say that one Variable is the cause & other the effect. | 2. in regression analysis it is possible to study Cause & effect relationship. |
| 3. In Correlation analysis both rxy & ryx are Symmetric (rxy=ryx) | 3. In regression analysis bxy & byx are not Symmetric. (bxy≠byx) |
| 4. There may be measure Correlation which has no practical relevance such as Increase in income & increase in weight. | 4. There is nothing like non-Sense regression. |
| 5. Correlation coeff. is independent of change of scale and origin. | 5. Regression coefficientsare independent of change of origin but not of scale. |
|
Similarity: Correlation coeff. (r) and regression coeff. (bxy & byx always have Same Sign. |
|
UTILITY OF REGRESSION
(i) Nature of Relationship:-
Regression analysis explains the nature of relationship between two variables.
(ii) Estimation of Relationship:-
The mutual relationship between two or more variables can be measured easily by regression analysis.
(iii) Prediction:-
By regression analysis, the value of a dependent variable can be predicted on the basis of the value of an independent variable. For example, if the price of a commodity rises, what will be the probable fall in demand, this can be predicted by regression.
(iv) Useful in Economic and Business research:-
Regression analysis is very useful in business and economic research. With the help of regression, business and economic policies can be formulated.
TYPES OF REGRESSION ANALYSIS
1. Simple and Multiple Regression:-
In simple regression analysis, we study only two variables at the time, in which one variable is dependent and another is independent. For example income and expenditure.
on the contrary, we study more than two variables at a time in multiple, regression analysis in which one is dependent variable and others are independent variable. For example the study of rain and irrigation, the study of effect of rain and irrigation on yield of wheat.
2. Linear and Non-Linear Regression:-
when one variable changes with other variable in some fixed ratio, this is called linear regression. such type of relationship is depicted on a graph by means of straight line.
On the other hand when one variable varies with other variable in a changing ratio, then it is referred to as curvi-linear or Non-linear regression. This relationship, expressed on a graph paper takes the form of curve.
3. Partial and Total Regression:-
When two or more variables are studied for functional relationship but at a time relationship between only two variables is studied and other variables held constant then it is known as partial regression. On the other hand, in total regression all variables are studied simultaneous for the relationship among them.
Simple Linear Regression
Regression lines:
Regression lines are linear equations that show the relationship between two variables. These help in making predictions, understanding trends and determining the direction of changes in the data.
| Regression lines | |
| Regression line of y on x | Regression line of x on y |
| 1. y-ȳ = byx (x-x̄)
byx is regression coeff. of y on x byx = |
1. x-x̄ = bxy (y-ȳ)
bxy is regression coeff. of x on y bxy = |
| Both lines intersect at point (x̄, ȳ), x̄ = Mean of x, ȳ = Mean of y | |
| 2. x→ Independent variable
y→ Dependent variable |
2. x→Dependent variable
y→ Independent variable |
| 3. Used to calculate y for given x | 3. Used to calculate y for given y |
| 4. Regression equation of y on x, y = a+bx | 4. Regression equation of x on y, x = a+by |
Methods of Obtaining Regression Lines
(i) Scatter Diagram Method:-
This is the simplest method of constructing regression lines, In this method, values of the related variables are plotted on a graph. A straight line is drawn passing through the plotted points. The straight line is drawn with free hand. This shape of regression line can be linear or non-linear also. This depends upon the location of plotted points. This method is very rarely used in practicle because in this method, the decision of the person who draws the regression lines very much affects the result.
(ii) Least Square Method:-
Regression lines are also constructed by least Square method. Under this method, the two regression lines, is fitted through different points in such a way that the sum of squares of the deviations of the observed values from the fitted line shall be least. The line drawn by this method is called the Line of Best Fit. In other words, regression line of Y on X is so drawn such that vertically, the sum of squared deviation becomes minimum relating to the different points and the regression line on X on Y is so drawn such that horizontally, squared deviations of different points add up to minimum.
Regression Lines
and
Degree of Correlation


REGRESSION EQUATIONS
Regression equations are the algebraic formulation of regression lines. Regression equations present Regression lines.
(i) Regression equation of x on y
This equation is used to estimate the probable value of x on the basis of the given value of y.
⇒ x-x̄ = bxy (y-ȳ)
(ii) Regression Equation of y on x
This equation is used to estimate the probable value of y on the basis of given value of x.
⇒ y-ȳ = byx (x-x̄)
REGRESSION COEFFICIENTS
Regression Coefficient measures the average change in the value of one variable for a unit change in the value of another variable. r Infact, it represents the slope of a regression line.
(i) Regression Coefficient x on y
This Coefficient shows that with the unit change in the value of y variable, what will be the average change in the value of x variable.
bxy = r . σx/σy
(ii) Regression coefficient of y on x
This Coefficient shows that with a unit change in the value of x variable, what will be the average change in the value of y variable.
byx = r . σy/σx
Example (i) Find both regression lines (x on y and y on x) for the following data.
| x | y |
| 6 | 9 |
| 2 | 11 |
| 10 | 5 |
| 4 | 8 |
| 8 | 7 |
Calculation:
| x | y | x2 | y2 | xy |
| 6 | 9 | 36 | 81 | 54 |
| 2 | 11 | 4 | 121 | 22 |
| 10 | 5 | 100 | 25 | 50 |
| 4 | 8 | 16 | 64 | 32 |
| 8 | 7 | 64 | 49 | 56 |
| 30 | 40 | 220 | 340 | 214 |
n = 5
x̄ = Σx/n = 30/5 = 6
ȳ = Σy/n = 40/5 = 8
byx = 
= 5×214 – 30×40 / 5×220 – 30×30
= -0.65
bxy = 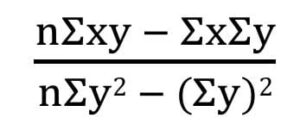
= 5×214 – 30×40 / 5×340 – 40×40
= -1.3
now,
x on y ⇒ x-x̄ = bxy (y-ȳ)
⇒ x-6 = -1.3(y-8)
⇒ x-6 = -1.3y + 1.3×8
⇒ x = -1.3y + 10.4 + 6
⇒ x = -1.3y + 16.4
y on x ⇒ y-ȳ = byx (x-x̄)
⇒ y-8 = -0.65 (x-6)
⇒ y-8 = -0.65x + 0.65×6
⇒ y = -0.65x + 3.9+8
Example (ii) From the following data:
(a) Obtain two regression lines
(b) Calculate correlation coeff.
(c) Estimate the value of y for x = 6.2
| x | y |
| 1 | 9 |
| 2 | 8 |
| 3 | 10 |
| 4 | 12 |
| 5 | 11 |
| 6 | 13 |
| 7 | 14 |
| 8 | 16 |
| 9 | 15 |
Calculation:
(a) Obtain two regression lines
Note: x on y ⇒ x-x̄ = bxy (y-ȳ)
y on x ⇒ y-ȳ = byx (x-x̄)
(i) For direct method
We’ll need ⇒ x̄, ȳ, bxy, byx
r = 
bxy =
byx =
Finally we’ll need ⇒ n, Σx, Σy, Σx2, Σy2, Σxy
(ii) For Short-cut method :-
समानान्तर माध्य की संख्या पूर्णांक में हो तो प्रत्यक्ष रीति द्वारा प्रतीपगमन गुणांक सरलता से प्राप्त किये जा सकते हैं, लेकिन यदि ये माध्य पूर्णांक में नहीं आये तब लघु रीति अपनाना अधिक उपयुक्त होगा। इस रीति में अग्र सूत्रों की सहायता से प्रतीपगमन गुणांकों की गणना की जाती है:
Note: x→ dx = x-A,
y→ dy = y-B
| x | y | dx
(x-5) |
dy
(y-12) |
dx2 | dy2 | dx dy |
| 1 | 9 | -4 | -3 | 16 | 9 | 12 |
| 2 | 8 | -3 | -4 | 9 | 16 | 12 |
| 3 | 10 | -2 | -2 | 4 | 4 | 4 |
| 4 | 12 | -1 | 0 | 1 | 0 | 0 |
| 5 (A) | 11 (B) | 0 | -1 | 0 | 1 | 0 |
| 6 | 13 | 1 | 1 | 1 | 1 | 1 |
| 7 | 14 | 2 | 2 | 4 | 4 | 4 |
| 8 | 16 | 3 | 4 | 9 | 16 | 12 |
| 9 | 15 | 4 | 3 | 16 | 9 | 12 |
| 45 | 108 | 0 | 0 | 60 | 60 | 57 |
Regression Co-efficient of X on Y
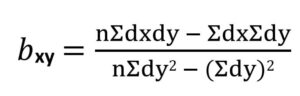
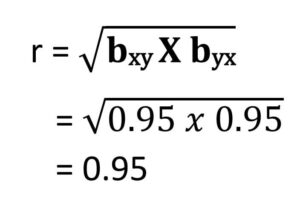
bxy = 9(57) – 0(0) / 9(60) – (0)2
= 0.95
Regression Co-efficient of Y on X
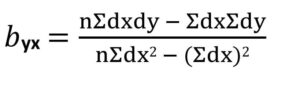
byx = 9(57) – 0(0) / 9(60) – (0)2
= 0.95
x̄ = Σx/n = 45/9 = 5
ȳ = Σy/n = 108/9 = 12
now,
x on y ⇒ x-x̄ = bxy (y-ȳ)
⇒ x – 5 = 0.95(y-12)
⇒ x – 5 = (0.95)y – 0.95(12)
⇒ x = (0.95)y – 11.4 + 5
⇒ x = (0.95)y – 6.4
y on x ⇒ y-ȳ = byx (x-x̄)
⇒ y – 12 = 0.95(x – 5)
⇒ y – 12 = (0.95)x – 0.95 (5)
⇒ y – 12 = (0.95)x – 4.75
⇒ y = (0.95)x – 4.75 + 12
⇒ y = (0.95)x + 7.25
(b) Calculate correlation coeff.
(c) Estimate the value of y for x = 6.2
y on x ⇒ y-ȳ = byx (x-x̄)
⇒ y = (0.95)x + 7.25
⇒ y = (0.95)6.2 + 7.25
⇒ y = 5.89 + 7.25
⇒ y = 13.14