14. Correlation analysis (सहसंबंध विश्लेषण)
Correlation analysis
(सहसंबंध विश्लेषण)
⇒ Correlation analysis deals with the association between two or more Variables.
⇒ The degree of relationship between the Variables Under consideration is measured through the correlation analysis.
⇒ The measure of correlation called the “Correlation coefficient or correlation index” Summarizes in Figure the direction & degree one of correlation.
Example1
| x⇑ | y⇑ |
| 10 | 15 |
| 12 | 20 |
| 15 | 22 |
| 18 | 25 |
| 20 | 37 |
| 25 | 43 |
| x⇑ | y⇓ |
| 20 | 40 |
| 30 | 30 |
| 40 | 22 |
| 50 | 15 |
| 60 | 10 |
| 80 | 4 |
👉 दिए गए आँकड़ों में जैसे-जैसे x का मान बढ़ता है, वैसे-वैसे y का मान घटता जाता है।
👉 अतः x और y के बीच नकारात्मक (ऋणात्मक) सहसंबंध पाया जाता है।
👉 चूँकि परिवर्तन नियमित और स्पष्ट है, इसलिए यह प्रबल नकारात्मक सहसंबंध (Strong Negative Correlation) को दर्शाता है।
Type of Correlation
1. Positive Correlation (Direct Correlation):-
If both the Variable in Same direction. x⇑, y⇑ or x⇓, y⇓ e.g., Height & Weight, Rainfall & Yeild
2. Negative Correlation (Inverse Correlation):-
If both the variables Varies in opposite direction. x⇑, y⇓ or x⇓, y⇑ e.g., Price & Demand
3. Zero Correlation (No Correlation):-
When there is no relationship between variables. or When one variable changes, the other variable does not change in any consistent way. x⇑⇓, y or x, y⇑⇓ e.g., Shoe size & intelligence
Correlation Coefficient (r)
The correlation coefficient is a statistical measure that shows the strength and direction of the relationship between two variables. Its value ranges from −1 to +1, where positive values indicate direct correlation, negative values indicate inverse correlation, and zero indicates no relationship.
r = +1 ⇒ Perfect Positive Correlation,
r = -1 ⇒ Perfect Negative Correlation,
r = 0 ⇒ No Relation,
r = 0.8, 0.9, 0.95 अर्थात जब r का Value 1 के करीब आता है तो उसे Strong +ve Correlation कहा जाता है।
r = -0.85, -0.9, -0.95 अर्थात जब r का Value लगभग -1 के करीब आता है तो उसे Strong Negative Correlation कहा जाता है।
Method of Finding Correlation Coefficient (r)
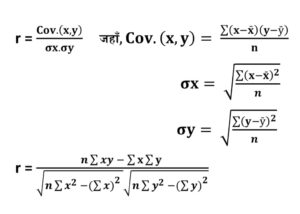
The correlation coefficient (r) is found using several methods. The Karl Pearson’s method is the most common, where r is calculated by dividing the covariance of two variables by the product of their standard deviations.
The Spearman’s rank correlation method is used when data are ranked or not normally distributed.
Another method is the concurrent deviations method, suitable for time-series data showing direction of change.
Scatter diagram method finds correlation coefficient (r) by plotting paired data points, observing pattern direction, and estimating strength visually.
These methods help measure the degree and direction of relationship between variables, with values of r ranging from –1 to +1.
1. Karl Pearson’s method
2. Spearman’s rank correlation method
3. Concurrent deviations method
4. Scatter diagram method
1. Karl Pearson’s Product Moment Method
Karl Pearson’s Product Moment Method measures the degree and direction of linear relationship between two quantitative variables. It uses covariance divided by the product of their standard deviations, producing a correlation coefficient (r) ranging from –1 to +1, indicating negative, positive, or no correlation.
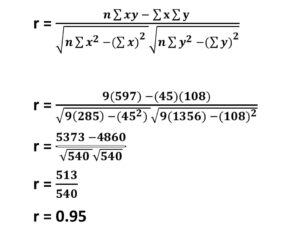
Ex. (i) Find coefficient of correlation of the following data.
| x | y |
| 9 | 15 |
| 8 | 16 |
| 7 | 14 |
| 6 | 13 |
| 5 | 11 |
| 4 | 12 |
| 3 | 10 |
| 2 | 8 |
| 1 | 9 |
Solution:
| x | y | x2 | y2 | xy |
| 9 | 15 | 81 | 225 | 135 |
| 8 | 16 | 64 | 256 | 128 |
| 7 | 14 | 49 | 196 | 98 |
| 6 | 13 | 36 | 169 | 78 |
| 5 | 11 | 25 | 121 | 55 |
| 4 | 12 | 16 | 144 | 48 |
| 3 | 10 | 9 | 100 | 30 |
| 2 | 8 | 4 | 64 | 16 |
| 1 | 9 | 1 | 81 | 9 |
| Total sum = 45 | 108 | 285 | 1356 | 597 |
n = No. of pair of observers
n = 9
Σxy = 597
Σx = 45
Σy = 108
Σx2 = 285
Σy2 = 1356