1. Meaning and Definition of Geography (भूगोल का अर्थ एवं परिभाषा)

Meaning and Definition of Geography

(भूगोल का अर्थ एवं परिभाषा)


Meaning and Definition of Geography

परिचय

    भूगोल एक ऐसा विज्ञान है जो पृथ्वी की सतह, उस पर पाए जाने वाले प्राकृतिक तथा मानवीय तत्वों और उनके पारस्परिक संबंधों का अध्ययन करता है।

    मानव जीवन प्रत्यक्ष या अप्रत्यक्ष रूप से पृथ्वी के भौतिक वातावरण से जुड़ा हुआ है। पर्वत, मैदान, नदियाँ, जलवायु, मिट्टी, वनस्पति तथा मानव की आर्थिक, सामाजिक और सांस्कृतिक गतिविधियाँ इन सभी का स्थानिक (Spatial) वितरण और पारस्परिक प्रभाव भूगोल के अध्ययन का मुख्य विषय है। इसलिए भूगोल को “पृथ्वी और मानव के संबंधों का विज्ञान” भी कहा जाता है।

भूगोल शब्द की उत्पत्ति (Etymology)

     ‘भूगोल’ शब्द की उत्पत्ति दो ग्रीक शब्दों से हुई है-

1. Geo = पृथ्वी

2. Graphy = वर्णन / विवरण

     इस प्रकार भूगोल का शाब्दिक अर्थ हुआ- “पृथ्वी का वर्णन”। प्रारंभिक काल में भूगोल का उद्देश्य केवल पृथ्वी, महाद्वीपों, महासागरों, पर्वतों और देशों का वर्णन करना था, परंतु समय के साथ इसका क्षेत्र अत्यंत व्यापक और वैज्ञानिक हो गया।

भूगोल का अर्थ (Meaning of Geography)

     भूगोल का अर्थ केवल पृथ्वी का वर्णन करना नहीं है, बल्कि यह पृथ्वी की सतह पर होने वाली प्राकृतिक प्रक्रियाओं तथा मानव क्रियाओं का वैज्ञानिक अध्ययन करता है। भूगोल यह समझने का प्रयास करता है कि-

✍️ विभिन्न प्राकृतिक तत्व (जैसे जलवायु, स्थलरूप, मिट्टी) मानव जीवन को कैसे प्रभावित करते हैं।

✍️ मानव अपनी आवश्यकताओं के अनुसार प्राकृतिक पर्यावरण को किस प्रकार परिवर्तित करता है।

✍️ विभिन्न भौगोलिक तत्वों का स्थानिक वितरण (Spatial Distribution) क्यों और कैसे होता है।

    इस प्रकार भूगोल एक समन्वयात्मक (Integrative) विज्ञान है, जो प्राकृतिक विज्ञान और सामाजिक विज्ञान इन दोनों के बीच सेतु का कार्य करता है।

भूगोल की प्रमुख परिभाषाएँ

(Definitions of Geography)

(i) प्राचीन विद्वानों की परिभाषाएँ

✍️ हिकेटियस (Hecataeus):-

       “भूगोल पृथ्वी की सतह और उस पर स्थित वस्तुओं का वर्णन है।”

✍️ टॉलेमी (Ptolemy):-

      “भूगोल पृथ्वी के ज्ञात भागों का मानचित्रात्मक विवरण प्रस्तुत करता है।”

✍️ प्राचीन काल में भूगोल मुख्यतः वर्णनात्मक (Descriptive) था।

(ii) आधुनिक विद्वानों की परिभाषाएँ

✍️ इमैनुअल कांट (Immanuel Kant):-

     “भूगोल वह विज्ञान है जो पृथ्वी की सतह पर घटित घटनाओं का स्थान के आधार पर अध्ययन करता है।”

✍️ अलेक्जेंडर वॉन हम्बोल्ट (Alexander von Humboldt):-

     “भूगोल पृथ्वी की सतह पर प्राकृतिक घटनाओं की पारस्परिक निर्भरता का अध्ययन करता है।”

✍️ कार्ल रिटर (Carl Ritter):-

    “भूगोल पृथ्वी को मानव का निवास स्थान मानकर मानव और प्रकृति के संबंधों का अध्ययन करता है।”

✍️ रिचर्ड हार्टशोर्न (Richard Hartshorne):-

    “भूगोल का उद्देश्य पृथ्वी की सतह पर घटित विभिन्न घटनाओं के क्षेत्रीय भेदों (Areal Differentiation) का अध्ययन करना है।”

✍️ एलन सी. सेम्पल (Ellen C. Semple):-

    “भूगोल मानव और उसके भौतिक पर्यावरण के संबंधों का अध्ययन है।”

    इन परिभाषाओं से स्पष्ट होता है कि आधुनिक भूगोल केवल वर्णनात्मक न होकर विश्लेषणात्मक और वैज्ञानिक है।

भूगोल की प्रकृति

(Nature of Geography)

    भूगोल की प्रकृति को निम्नलिखित बिंदुओं से समझा जा सकता है-

(i) स्थानिक विज्ञान (Spatial Science):-

     भूगोल स्थान, दूरी, दिशा और वितरण का अध्ययन करता है।

(ii) समन्वयात्मक विज्ञान:-

    यह भौतिक और मानव तत्वों को जोड़कर देखता है।

(iii) गतिशील विज्ञान:-

    प्राकृतिक एवं मानवीय प्रक्रियाएँ समय के साथ बदलती रहती हैं।

(iv) व्यावहारिक विज्ञान:-

    भूगोल का उपयोग योजना निर्माण, पर्यावरण संरक्षण, आपदा प्रबंधन आदि में होता है।

भूगोल का अध्ययन क्षेत्र

(Scope of Geography)

     भूगोल का अध्ययन क्षेत्र बहुत व्यापक है, जिसमें प्रमुख रूप से शामिल हैं-

✍️ भौतिक भूगोल: स्थलरूप, जलवायु, महासागर, मिट्टी, जैव भूगोल

✍️ मानव भूगोल: जनसंख्या, कृषि, उद्योग, बस्तियाँ, परिवहन

✍️ आर्थिक भूगोल

✍️ राजनीतिक भूगोल

✍️ पर्यावरण भूगोल

✍️ प्रादेशिक भूगोल इत्यादि

निष्कर्ष

    अतः यह स्पष्ट है कि भूगोल केवल पृथ्वी का साधारण वर्णन नहीं, बल्कि एक व्यापक, वैज्ञानिक और उपयोगी विषय है। यह हमें पृथ्वी और मानव के बीच संतुलन बनाए रखने की समझ देता है।

   आज के समय में जब पर्यावरणीय संकट, संसाधनों की कमी और शहरीकरण की समस्याएँ बढ़ रही हैं, तब भूगोल का महत्व और भी अधिक बढ़ गया है।

संक्षेप में कहा जाए तो-
👉 भूगोल पृथ्वी, प्रकृति और मानव के पारस्परिक संबंधों का समग्र अध्ययन है।  अर्थात Geography is the holistic study of the interrelationships of the earth, nature, and human beings.

15. Range (परास / परिसर / विस्तार)

Range

(परास)


Range

परिचय

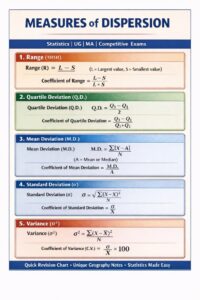
       परास (Range) प्रसरण का सबसे सरल और प्रारम्भिक मापक है। यह किसी आँकड़ा-समूह में सबसे बड़े मान (L) और सबसे छोटे मान (S) के बीच का अंतर दर्शाता है। इससे यह पता चलता है कि आँकड़े कितनी सीमा तक फैले हुए हैं।

     दूसरे शब्दों में किसी श्रृंखला के सबसे बड़े मूल्य और सबसे छोटे मूल्य के अंतर को परिसर या विस्तार कहते है।

परिभाषा (Definition)

    परास वह अंतर है जो किसी श्रेणी के अधिकतम मान और न्यूनतम मान के बीच होता है।

सूत्र (Formula)

Range (R) = L−S

जहाँ,

= सबसे बड़ा मान (Largest Value / Observation)

= सबसे छोटा मान (Smallest Value / Observation)

परास का गुणांक (Coefficient of Range)

     परास के तुलनात्मक अध्ययन के लिए परास का गुणांक प्रयोग किया जाता है।

Coefficient of Range = (L − S) / (L + S)

✍️ विशेषता:- इसका मान 0 और 1 के बीच होता है।

उदाहरण (Example)

मान लीजिए आँकड़े हैं: 5, 8, 12, 20, 25

L = 25

S = 5

Range

R = 25−5 = 20

Coefficient of Range

(25−5) / (25+5) = 20/30 =0.67

परास के लाभ (Merits)

✍️ Dispersion के सभी methods में यह सबसे सरल व आसान है।

✍️ प्रारम्भिक विश्लेषण के लिए उपयोगी।

✍️ आँकड़ों के फैलाव का त्वरित अनुमान देता है।

परास की सीमाएँ (Demerits)

✍️ Range is not based on each and every observation of the series.

✍️ केवल दो चरम मानों (L और S) पर आधारित।

✍️ चरम मानों के परिवर्तन से बहुत प्रभावित।

✍️ संपूर्ण आँकड़ा-समूह का सही प्रतिनिधित्व नहीं करता।

✍️ We can not calculate Range for open end classification.

उपयोग (Uses)

✍️ मौसम विज्ञान (तापमान का अंतर)

✍️ शेयर बाजार (उच्चतम–न्यूनतम भाव)

✍️ खेल, परीक्षा अंकों का प्रारम्भिक विश्लेषण

✍️ उद्योगों में quality नियंत्रण में उपयोगी

✍️Everyday life (सब्जी या कोई सामान का range)

निष्कर्ष (Conclusion)

    परास प्रसरण का सबसे सरल मापक है, परन्तु इसकी सीमाओं के कारण गहन सांख्यिकीय विश्लेषण में अन्य मापकों (चतुर्थक विचलन, माध्य विचलन, मानक विचलन) का प्रयोग अधिक उपयुक्त माना जाता है।


NOTE: Type of series

(i) Indivisual Series

(ii) Discrete Series

(iii) Continuous Series 

                   ⇓

(a) Exclusive Series

(b) Inclusive Series

उदाहरण (Example)

(i) Indivisual Series

1. 13, 20, 7, 15, 29, 35 इस सीरीज का Range और Coefficient of Range निकालें।

हल:

L = 35

S = 7

Range = L – S = 35 – 7 = 28

Coefficient of Range = (L-S)/(L+S)

= (35 – 7)/(35 + 7) = 28/42 = 0.67

2.  50, 69, 92, 85, 55, 20, 30 इस सीरीज का Range और Coefficient of Range निकालें।

हल:

L = 92

S = 20

Range = L – S =92-20 = 72

Coefficient of Range = (L-S)/(L+S)

= (92-20)/(92+20) = 72/112 = 0.64

(ii) Discrete Series (खंडित श्रेणी)

3. दिए गये सीरीज का Range और Coefficient of Range निकालें।

x f
5 3
10 7
15 5
20 12
25 9

हल:

Note : ऐसे series में Frequency को ignore करना है

L = 25

S = 5

Range = L – S = 25 – 5 = 20

Coefficient of Range = (L-S)/(L+S)

= (25-20)/(25+5) = 20/30 = 0.67

4. दिए गये सीरीज का Range और Coefficient of Range निकालें।

x f
133 9
180 2
80 4
95 5
40 3
132 10

हल:

L = 180

S = 40

Range = L – S = 180 – 40 = 140

Coefficient of Range = (L-S)/(L+S)

= (180-40)/(180+40) = 140/220 = 0.63

(iii) Continuous Series : (a) Exclusive Series

5. दिए गये सीरीज का Range और Coefficient of Range निकालें।

x f
20-25 2
25-30 5
30-35 9
35-40 4
40-45 7

हल:

Note : ऐसे Series में भी Frequency को ignore करना है

L = 45

S = 20

Range = L – S = 45 – 20 = 25

Coefficient of Range = (L-S)/(L+S)

= (45-20)/(45+20) = 25/65 = 0.38

(b) Inclusive Series

5. दिए गये सीरीज का Range और Coefficient of Range निकालें।

x f
20-24 2
25-29 5
30-34 9
35-39 4
40-44 7

हल:

       सबसे पहले यहाँ Inclusive Series को Exclusive Series में बदलते है और यहाँ भी Frequency को ignore करना है

इसके लिए (24+25)/2 = 49/2 = 24.5 इसी तरह सभी निकालें

x f
19.5-24.5 2
24.5-29.5 5
29.5-34.5 9
34.5-39.5 4
39.5-44.5 7

अब, L = 44.5

S = 19.5

Range = L – S = 44.5-19.5 = 25

Coefficient of Range = (L-S)/(L+S)

= (44.5-19.5)/(44.5+19.5) =25/63 = 0.40

14. Measurement of Dispersion (प्रसरण / अपकिरण / विचलन / प्रकीर्णन / फैलाव का मापन)

Measurement of Dispersion

(प्रसरण का मापन)

Measurement of Dispersion

परिचय

     सांख्यिकी में केवल केन्द्रीय प्रवृत्ति के माप (Mean, Median, Mode) से किसी आँकड़ा-समूह की पूर्ण जानकारी नहीं मिलती। दो अलग-अलग आँकड़ा-समूहों का औसत समान हो सकता है, परंतु उनके मानों का फैलाव (विचलन) अलग-अलग हो सकता है। आँकड़ों के इसी फैलाव या बिखराव को प्रसरण (Dispersion) कहा जाता है। अतः प्रसरण का मापन यह बताता है कि आँकड़े अपने केन्द्रीय मान (Mean, Median, Mode) से कितनी दूरी तक फैले हुए हैं।

सरल शब्दों में, प्रसरण का मापन आँकड़ों की अस्थिरता, विविधता तथा समानता/असमानता को मापने का साधन है।

✍️ Dispersion measures the extent to which the items vary from some central value.

✍️ Average deviation is known as dispersion.

✍️ Central value- Mean, Median, Mode

✍️ Dispersion is also known as scatter, spread or variation.

Example 

(i) 2, 4, 9

AM = Σx/n

     = 2+4+9/3

       = 15/3

       = 3

(ii)

Series A Series B Series C
100 98 1
100 99 2
100 100 3
100 101 4
100 102 490
= 500/5 = 100 500/5 = 100 500/5 = 100

       यह तालिका दर्शाती है कि तीनों श्रेणियों (Series A, B और C) का औसत (̄ = 100) समान है, लेकिन मानों का वितरण अलग-अलग है। Series A में कोई प्रसरण नहीं, Series B में कम प्रसरण, जबकि Series C में अत्यधिक प्रसरण है।

प्रसरण की परिभाषा

        कई विद्वानों ने अपकिरण को परिभाषित किया है जिनमें निम्न प्रमुख हैं :-

(1) बुक्स एवं डिक (B. C. Brooks and W. F. L. Dick) के अनुसार, “अपकिरण अथवा प्रसार, एक केन्द्रीय मूल्य के इर्द-गिर्द चर मूल्यों (variables) के विचरण अथवा बिखराव की सीमा है।”

(2) प्रो. किंग (W. I. King) के शब्दों में, “अपकिरण शब्द का प्रयोग यह स्पष्ट करने के लिए किया जाता है कि एक दिये गये समूह के पद-मूल्यों में भिन्नता है। दूसरे शब्दों में, उसके मूल्यों में एकरूपता का अभाव है। “

(3) प्रो. कॉनर (L. R. Connor) के अनुसार, “अपकिरण उस सीमा, जिस तक व्यक्तिगत पद विलित है, की एक माप है।”

क्रॉक्सटन और काउडेन के अनुसार-

      “प्रसरण वह माप है जो यह दर्शाता है कि किसी श्रृंखला के व्यक्तिगत मान औसत के चारों ओर किस सीमा तक बिखरे हुए हैं।

प्रसरण के मापन की आवश्यकता (महत्त्व)

    प्रसरण के मापन की आवश्यकता निम्न कारणों से होती है-

✍️ आँकड़ों की स्थिरता या अस्थिरता का ज्ञान

✍️ दो या अधिक श्रृंखलाओं की तुलना

✍️ औसत की विश्वसनीयता जाँचने हेतु

✍️ जोखिम (Risk) और अनिश्चितता के विश्लेषण में

✍️ नीति निर्माण, योजना तथा अनुसंधान में सहायता

✍️ आर्थिक, भौगोलिक एवं सामाजिक अध्ययनों में उपयोग

प्रसरण के मापन के प्रकार

   प्रसरण के मापन को मुख्यतः दो भागों में बाँटा जाता है-

1. निरपेक्ष माप (Absolute Measures)

2. सापेक्ष माप (Relative Measures)

(1) निरपेक्ष माप (Absolute Measure):-

     जब किसी श्रेणी के बिखराव की माप निरपेक्ष रूप में उस श्रेणी की इकाई में ही व्यक्त की जाती है तो वह अपकिरण की निरपेक्ष माप कहलाती है, जैसे कीमत रुपयो में, लम्बाई मीटर में, वजन किलोग्राम में व्यक्त किया जाता है। यदि यह कहा जाए कि श्रमिको के एक समूह की औसत मजदूरी ₹200 है तथा अपकिरण ₹ 15 है तो यह मद अपकिरण का निरपेक्ष माप कहलाएगा।

    अपकिरण के ऐसे मापों की तुलना तभी सम्भव होती है जब दो श्रेणियाँ एक जैसी हो तथा उन्हें एक जैसी इकाइयां, जैसे-किलोग्राम, रुपये आदि द्वारा प्रकट किया जाए। यदि वितरण दो अलग समंकों से सम्बन्धित है तथा इनकी इकाइयाँ भिन्न है है तो ये माप तुलना में सहायक नहीं होते।

(2) सापेक्ष माप (Relative Measure):-

      जैसा कि हमने अध्ययन किया कि अपकिरण के निरपेक्ष माप में यह दोष है कि इसमें विभिन्न श्रेणियों की इकाइयों अलग-अलग होने पर उनमें परस्पर तुलना सम्भव नहीं होती है। अतः इनके मापों को तुलना योग्य बनाने के लिए इनको सापेक्ष रूप में बदला जाता है। अपकिरण के निरपेक्ष माप को श्रेणी के माध्य भाग देने पर जो अनुपात आता है, उसे अकिरण की सापेक्ष माप कहते हैं।

      उदाहरण के लिए, यदि कहा जाए कि भारत में 27 प्रतिशत व्यक्ति निर्धनता रेखा से नीचे है तो यह सापेक्ष माप होगी। सापेक्ष माप को ज्ञात करने के लिए मध्य मूल्य को औसत से भाग कर दिया जाता है या उसका प्रतिशन ज्ञात किया जाता है। स्पष्ट है कि सापेक्ष माप समंक श्रेणी की इकाई में व्यक्त न होकर एक अनुपात या प्रतिशत के रूप में व्यक्त होती है। इसे अपकिरण गुणांक (Co-efficient of Dispersion) भी कहते है।

अपकिरण मापने की विधियाँ (Method of  Measuring Dispersion)

        अपकिरण मापने की विधियाँ इस प्रकार है-

Measures of Dispersion
Absolute Measure (Same unit) Relative Measure (Unit free)
1. Rane 1. Coefficient of Range
2. Quartile Deviation 2. Coefficient of Quartile Deviation
3. Mean Deviation 3. Coefficient of Mean Deviation
4. Standard Deviation 4. Coefficient of Standard Deviation
5. Variance 5. Coefficient of Variance

निष्कर्ष:

     प्रसरण का मापन सांख्यिकी का एक अत्यंत महत्त्वपूर्ण अंग है। केवल औसत आँकड़ों की पूरी तस्वीर प्रस्तुत नहीं कर सकता, जब तक कि उसके साथ प्रसरण का अध्ययन न किया जाए।

    परास, चतुर्थक विचलन, औसत विचलन, परिवर्तन तथा मानक विचलन ये सभी प्रसरण के विभिन्न स्तरों को समझने में सहायक हैं। विशेष रूप से मानक विचलन और परिवर्तन गुणांक आधुनिक सांख्यिकीय विश्लेषण में सर्वाधिक उपयोगी माने जाते हैं।

    अतः किसी भी आँकड़ा-विश्लेषण को पूर्ण और विश्वसनीय बनाने के लिए प्रसरण के मापन का अध्ययन अनिवार्य है।


नोट: सिर्फ सांख्यिकीय माध्य का ज्ञान रखने वाले एक व्यक्ति ने सपरिवार नदी पार करने से पहले नदी की औसत गहराई और अपने परिवार की औसत ऊँचाई ज्ञात की।

    नदी की औसत गहराई 4 फीट तथा उसके परिका की औसत ऊँचाई 5 फीट थी। इस विश्वास के साथ सभी लोग नदी पार करने लगे, परन्तु एक स्थान पर नहीं की गहराई 10 फीट थी जहाँ वह परिवार डूब गया।

   यदि उस व्यक्ति ने नदी की अधिकतम गहराई और आने परिवार के सदस्यों की न्यूनतम ऊँचाई को गणना कर ली होती तो शायद यह कहावत सुनने को नहीं मिलती कि-

लेखा जोखा ज्यों का त्यों,

सारा कुनबा डूबा क्यों।

    वह व्यक्ति सपरिवार डूब गया क्योंकि उसे अपकिरण की माप की जानकारी नहीं थी। अपकिरण की माप से हमे इस बात की जानकारी मिलती है कि आंकड़े औसत से कितनी दूरी पर अवस्थित है।

     उपर्युक्त लघु-कथा यह स्पष्ट करती है कि विभिन्न पद-मूल्यों का माध्य में विचलन महत्वपूर्ण होता है। किसी देश में औसत आय अथवा सम्पति काफी अधिक हो सकती है, साथ ही वहाँ उसके वितरण में पर्याप्त असमानता के कारण अधिकांश जनसंख्या निर्धनता की सीमा के नीचे हो सकती है। इस प्रकार के विचलनों को मापना तथा उन्हें एक संख्या में व्यक्त करना आवश्यक होता है।

Chapter 7 Landforms and their Evolution (भू-आकृतियाँ तथा उनका विकास)

Chapter 7 Landforms and their Evolution

(भू-आकृतियाँ तथा उनका विकास)

(भाग – 1 : भौतिक भूगोल के मूल सिद्धांत)

बिहार बोर्ड तथा NCERT कक्षा 11वीं के भूगोल का सम्पूर्ण प्रश्नोत्तर


1. बहुवैकल्पिक प्रश्न एवं उनके उत्तर

(i) स्थलरूप विकास की किस अवस्था में अधोमुख कटाव प्रमुख होता है?

(क) तरुणावस्था

(ख) प्रथम प्रौढ़ावस्था

(ग) अन्तिम प्रौढ़ावस्था

(घ) वृद्धावस्था

उत्तर- (क) तरुणावस्था

(ii) एक गहरी घाटी जिसकी विशेषता सीढ़ीनुमा खड़े ढाल होते हैं; किस नाम से जानी जाती है?

(क) U- आकार की घाटी

(ख) अन्धी घाटी

(ग) गॉर्ज

(घ) कैनियन

उत्तर- (घ) कैनियन

(iii) निम्न में से किन प्रदेशों में रसायनिक अपक्षय प्रक्रिया यान्त्रिक अपक्षय प्रक्रिया की अपेक्षा अधिक शक्तिशाली होती है?

(क) आर्द्र प्रदेश

(ख) शुष्क प्रदेश

(ग) चूना-पत्थर प्रदेश

(घ) हिमनद प्रदेश

उत्तर- (ग) चूना-पत्थर प्रदेश

(iv) निम्न में से कौन-सा वक्तव्य लेपीज (Lapies) शब्द को परिभाषित करता है?

(क) छोटे से मध्यम आकार के उथले गर्त।

(ख) ऐसे स्थलरूप जिनके ऊपरी मुख वृत्ताकार व नीचे से कीप के आकार के होते हैं।

(ग) ऐसे स्थलरूप जो धरातल से जल के टपकने से बनते हैं।

(घ) अनियमित धरातल जिनके तीखे कटक व खाँच हों।

उत्तर- (क) छोटे से मध्यम आकार के उथले गर्त।

लेपीज (Lapies) का सही अर्थ है – चूना पत्थर वाले क्षेत्रों में पाई जाने वाली अनियमित सतह, जिन पर तीखे कटक (ridges) और खांचे (grooves) बने होते हैं।

(v) गहरे, लम्बे व विस्तृत गर्त या बेसिन जिनके शीर्ष दीवार खड़े ढाल वाले व किनारे खड़े व अवतल होते हैं, उन्हें क्या कहते हैं?

(क) सर्क

(ख) पाश्विक हिमोढ़

(ग) घाटी हिमनद

(घ) एस्कर

उत्तर- (क) सर्क

(vi) यू-आकार की घाटी बनती है

(क) बाढ़ क्षेत्र में

(ख) चूना क्षेत्र में

(ग) प्रौढ़ नदी क्षेत्र

(घ) हिमानी नदी क्षेत्र में

उत्तर- (घ) हिमानी नदी क्षेत्र में

2. निम्नलिखित प्रश्नों के उत्तर लगभग 30 शब्दों में दीजिए

(i) चट्टानों में अध: कर्तित विसर्प और मैदानी भागों में जलोढ़ के सामान्य विसर्प क्या बताते हैं?

उत्तर- चट्टानों में अध:कर्तित विसर्प (inverted relief) दर्शाते हैं कि कठोर शिलाओं पर कटाव कम हुआ है और वे ऊँचे बने रहते हैं। जबकि मैदानी भागों में जलोढ़ के सामान्य विसर्प यह बताते हैं कि अवसादों पर अधिक क्षरण-संवहन होता है, जिससे निचले, समतल और व्यापक भू-आकृतियाँ बनती हैं।

(ii) घाटी रंध्र अथवा युवाला का विकास कैसे होता है?

उत्तर- डोलाइन घोलरन्ध्र का ही विकसित रूप है। डोलाइन एक अस्थायी झील के समान होता है। कुछ समय के बाद इसके जल संरोध के सहारे भूमिगत हो जाते हैं और झील सूख जाती है।

     जब दो डोलाइन आसपास होते हैं तो बढ़ते-बढ़ते उनके बीच की दीवार टूट कर गिर जाती है और वे आपस में मिल जाते हैं। इससे एक वृहद् गड्ढे का निर्माण होता है, जो युवाला (Uvalas) कहलाता है।

Chapter 7 Landforms and their Evolution

(iii) चूनायुक्त चट्टानी प्रदेशों में धरातलीय जल प्रवाह की अपेक्षा भौमजल प्रवाह अधिक पाया जाता है, क्यों?

उत्तर- चूनायुक्त (Limestone) चट्टानी प्रदेशों में चट्टानें अधिक दरारदार तथा भंगुर होती हैं, जिनमें जल शीघ्रता से नीचे समा जाता है। सतह पर जल लंबे समय तक ठहर नहीं पाता, इसलिए धरातलीय जल प्रवाह कम और भूमिगत जल प्रवाह अधिक विकसित होता है। इसी कारण कार्स्ट स्थलरूप भी बनते हैं।

(iv) हिमनद घाटियों में कई रैखिक निक्षेपण स्थलरूप मिलते हैं। इनकी अवस्थिति व नाम बताएं।

उत्तर- हिमनद घाटियों में आगे बढ़ते और पिघलते ग्लेशियर रैखिक निक्षेपण स्थलरूप बनाते हैं। इनमें मोराइन (लैटरल, मेडियल, टर्मिनल), एस्कर, ड्रमलिन और आउटवॉश प्लेन प्रमुख हैं। ये इसलिए बनते हैं क्योंकि बर्फ के साथ खिंचती चट्टानें घाटी की दिशा में लंबवत रूप से निक्षेपित होती रहती हैं।

(v) मरुस्थलीय क्षेत्रों में पवन कैसे अपना कार्य करती है? क्या मरुस्थलों में यही एक कारक अपरनदित स्थलरूपों का निर्माण करता है?

उत्तर- मरुस्थलीय क्षेत्रों में पवन मुख्य रूप से अपवाहन (Deflation), अपघर्षण (Abrasion), सन्निघर्षण (Attrition) और परिवहन-निक्षेपण के माध्यम से कार्य करती है, जिससे बालू के टीले, ज्यूगेन, यार्डांग, गारा, छत्रक शिला,  बालूस्तूप, लोएस मैदान आदि बनते हैं।

    परंतु केवल पवन ही नहीं तापीय विस्तार-संकुचन, आकस्मिक व भारी वर्षा, और यांत्रिक अपक्षय भी मरुस्थलों में अपरदित स्थलरूपों के निर्माण में महत्वपूर्ण भूमिका निभाते हैं।

3. निम्नलिखित प्रश्नों के उत्तर लगभग 150 शब्दों में दीजिए

(i) आर्द्र व शुष्क जलवायु प्रदेशों में प्रवाहित जल ही सबसे महत्त्वपूर्ण भू-आकृतिक कारक है। विस्तार से वर्णन करें।

उत्तर- आर्द्र एवं शुष्क जलवायु प्रदेशों में प्रवाहित जल (Running Water) सबसे महत्त्वपूर्ण भू-आकृतिक कारक माना जाता है, क्योंकि यही भूमि के अपरदन, परिवहन एवं निक्षेपण की प्रक्रियाओं को नियंत्रित करता है।

   आर्द्र जलवायु प्रदेशों में वर्षा की मात्रा अधिक होती है। यहाँ नदियाँ, झरने एवं सतही जल निरंतर प्रवाहित होते रहते हैं। अधिक वर्षा के कारण रासायनिक अपक्षय तीव्र होता है तथा नदियाँ भूमि को काटकर V-आकार की घाटियाँ, घुमावदार नदियाँ (मेन्डर), बाढ़ मैदान, जलप्रपात एवं डेल्टा जैसी भू-आकृतियों का निर्माण करती हैं। इन क्षेत्रों में प्रवाहित जल का कार्य दीर्घकालिक एवं निरंतर होता है, जिससे परिदृश्य में व्यापक परिवर्तन दिखाई देता है।

     शुष्क जलवायु प्रदेशों में वर्षा बहुत कम होती है, परंतु जब अल्पकालिक एवं तीव्र वर्षा होती है, तब प्रवाहित जल अचानक शक्तिशाली रूप धारण कर लेता है। यहाँ अस्थायी नदियाँ (वाडी/अरॉय) बनती हैं, जो तीव्र अपरदन करती हैं। इनके द्वारा गॉर्ज, कैनियन, अल्यूवियल फैन एवं पेडीमेंट जैसी भू-आकृतियाँ विकसित होती हैं। यद्यपि जल का प्रवाह अल्पकालिक होता है, फिर भी उसका प्रभाव अत्यंत प्रभावशाली होता है।

  इस प्रकार स्पष्ट है कि आर्द्र और शुष्क दोनों जलवायु प्रदेशों में प्रवाहित जल भू-आकृतिक विकास का प्रमुख कारक है, जो विभिन्न स्थलरूपों के निर्माण में निर्णायक भूमिका निभाता है।

(ii) चूना चट्टानें आर्द्र व शुष्क जलवायु में भिन्न व्यवहार करती हैं क्यों? चूना प्रदेश में प्रमुख व मुख्य भू-आकृतिक प्रक्रिया कौन-सी हैं और इसके क्या परिणाम हैं।

उत्तर- चूना चट्टानें (Limestone Rocks) आर्द्र एवं शुष्क जलवायु में भिन्न व्यवहार करती हैं, क्योंकि दोनों जलवायुओं में जल की उपलब्धता, तापमान, वर्षा की मात्रा तथा रासायनिक क्रियाओं की तीव्रता अलग-अलग होती है।

   आर्द्र जलवायु में वर्षा अधिक होती है तथा वायुमंडल में कार्बन डाइऑक्साइड की मात्रा भी अपेक्षाकृत अधिक होती है। वर्षा जल CO के साथ मिलकर कार्बोनिक अम्ल बनाता है, जो चूना पत्थर को घोल देता है। इस कारण यहाँ रासायनिक अपक्षय (Dissolution / Solution) प्रमुख होता है। इसके परिणामस्वरूप कार्स्ट स्थलाकृतियाँ विकसित होती हैं, जैसे-डोलाइन, यूवाला, पोल्जे, गुफाएँ, स्टैलेक्टाइट और स्टैलेग्माइट।

   इसके विपरीत शुष्क जलवायु में वर्षा अत्यंत कम होती है, जिससे रासायनिक क्रियाएँ सीमित रहती हैं। यहाँ यांत्रिक अपक्षय, तापीय विस्तार-संकुचन तथा पवन क्रिया प्रमुख होती है। चूना चट्टानों का घुलन कम होता है और सतह अपेक्षाकृत कठोर बनी रहती है।

    चूना प्रदेश में प्रमुख भू-आकृतिक प्रक्रियाएँ हैं-

(i) रासायनिक अपक्षय (घुलन क्रिया)

(ii) भूमिगत जल क्रिया

(iii) अपरदन एवं निक्षेपण

   परिणामस्वरूप अनियमित स्थलरूप, भूमिगत नदियाँ, जल का तीव्र अपवाह, सतही नदियों का अभाव तथा कृषि के लिए सीमित उपयुक्तता देखने को मिलती है।

(iii) हिमनद ऊँचे पर्वतीय क्षेत्रों को निम्न पहाड़ियों व मैदानों में कैसे परिवर्तित करते हैं या किस प्रक्रिया से यह सम्पन्न होता है बताएँ?

उत्तर- हिमनद (Glaciers) ऊँचे पर्वतीय क्षेत्रों को धीरे-धीरे निम्न पहाड़ियों और विस्तृत मैदानों में परिवर्तित कर देते हैं। यह परिवर्तन मुख्यतः हिमानी अपरदन, परिवहन और निक्षेपण की प्रक्रियाओं के द्वारा सम्पन्न होता है।

    सबसे पहले, पर्वतीय क्षेत्रों में जमा भारी हिमराशि अपने भार के कारण ढलान की ओर खिसकती है। इस गति के दौरान हिमनद अपने साथ चट्टानों, पत्थरों और मलबे को लेकर चलता है। हिमनद की निचली सतह और किनारों में फँसे शैल-खंड भूमि को घिसते रहते हैं, जिसे हिमानी अपरदन कहा जाता है। इससे तीखे पर्वत शिखर घिसकर गोल हो जाते हैं और गहरी V-आकार की घाटियाँ चौड़ी होकर U-आकार की घाटियों में बदल जाती हैं।

    दूसरे चरण में, हिमनद अपरदित पदार्थों को दूर-दूर तक ले जाकर ढलानों से नीचे की ओर परिवहन करता है। जब हिमनद का वेग कम हो जाता है या वह पिघलने लगता है, तब ये शैल-खंड और मलबा वहीं जमा हो जाते हैं। इस प्रक्रिया को हिमानी निक्षेपण कहते हैं। इससे मोरैन, आउटवॉश मैदान तथा समतल भूमि का निर्माण होता है।

   इस प्रकार, लंबे समय तक चलने वाली हिमानी क्रियाएँ ऊँचे और खुरदरे पर्वतीय क्षेत्रों को घिस-घिसकर निम्न पहाड़ियों और समतल मैदानों में परिवर्तित कर देती हैं।

16. Scatter Diagram (स्कैटर आरेख)

Scatter Diagram

(स्कैटर आरेख)


Scatter Diagram

    सांख्यिकी (Statistics) में सहसंबंध (Correlation) का अर्थ दो चरों (Variables) के बीच संबंध की दिशा और मात्रा को समझना होता है। यह बताता है कि एक चर में परिवर्तन होने पर दूसरा चर किस प्रकार प्रभावित होता है।

    सहसंबंध के अध्ययन में स्कैटर आरेख (Scatter Diagram) एक अत्यंत सरल, दृश्यात्मक और प्रभावी विधि है, जिसके माध्यम से दो चरों के बीच संबंध को आसानी से समझा जा सकता है।

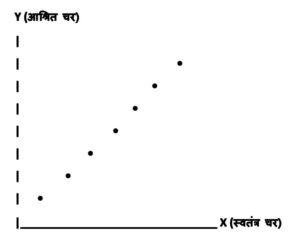
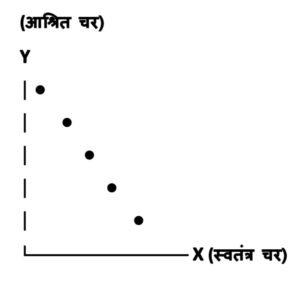
    स्कैटर आरेख को बिंदु आरेख भी कहा जाता है। इसमें दो चरों के मानों को ग्राफ पर बिंदुओं के रूप में दर्शाया जाता है। सामान्यतः स्वतंत्र चर (Independent Variable) को X-अक्ष पर और आश्रित चर (Dependent Variable) को Y-अक्ष पर अंकित किया जाता है।

    प्रत्येक युग्म (X, Y) को ग्राफ पर एक बिंदु (•) के रूप में प्रदर्शित किया जाता है। इन बिंदुओं के फैलाव और उनके झुकाव (Trend) से सहसंबंध की प्रकृति का अनुमान लगाया जाता है।

स्कैटर डायग्राम की परिभाषा

     स्कैटर डायग्राम वह आरेख है, जिसमें दो चरों से संबंधित आँकड़ों को ग्राफ पेपर पर बिंदुओं (Dots) के रूप में दर्शाया जाता है। एक चर को X-अक्ष (क्षैतिज अक्ष) पर तथा दूसरे चर को Y-अक्ष (ऊर्ध्वाधर अक्ष) पर रखा जाता है। दोनों चरों के मानों के युग्म (X, Y) को ग्राफ पर बिंदु के रूप में अंकित किया जाता है। इन बिंदुओं के फैलाव (Scatter) से यह ज्ञात होता है कि चरों के बीच किस प्रकार का सहसंबंध है।

स्कैटर डायग्राम की विशेषताएँ

    स्कैटर डायग्राम की कुछ प्रमुख विशेषताएँ निम्नलिखित हैं-

✍️ यह सहसंबंध को समझने की सबसे सरल और प्रारंभिक विधि है।

✍️ इसमें जटिल गणनाओं की आवश्यकता नहीं होती।

✍️ यह केवल सहसंबंध की दिशा और प्रकृति बताता है, उसकी सटीक मात्रा नहीं।

✍️ यह शोधकर्ताओं और विद्यार्थियों के लिए अत्यंत उपयोगी है।

✍️ यह सकारात्मक, नकारात्मक और शून्य सहसंबंध को स्पष्ट रूप से दर्शाता है।

स्कैटर डायग्राम बनाने की विधि

    स्कैटर डायग्राम बनाने की प्रक्रिया को निम्न चरणों में समझा जा सकता है-

(i) आँकड़ों का चयन:-

    सबसे पहले दो चरों से संबंधित आँकड़ों का चयन किया जाता है, जैसे- वर्षा और फसल उत्पादन, तापमान और आर्द्रता, जनसंख्या और संसाधन आदि।

(ii) अक्षों का निर्धारण:-

   एक चर को X-अक्ष पर और दूसरे चर को Y-अक्ष पर रखा जाता है। सामान्यतः स्वतंत्र चर (Independent Variable) को X-अक्ष पर और आश्रित चर (Dependent Variable) को Y-अक्ष पर रखा जाता है।

(iii) पैमाने का चयन:-

    दोनों अक्षों पर उपयुक्त पैमाना (Scale) निर्धारित किया जाता है, जिससे सभी मान ग्राफ पर सही ढंग से दर्शाया जा सकें।

(iv) बिंदुओं का अंकन:-

   प्रत्येक युग्म मान (X, Y) को ग्राफ पर केवल एक बिंदु के रूप में न कि रेखा रूप में अंकित किया जाता है।

(v) बिंदुओं का अवलोकन:-

   अंकित बिंदुओं के फैलाव को देखकर सहसंबंध की दिशा और प्रकार का अनुमान लगाया जाता है।

स्कैटर डायग्राम के प्रकार

     स्कैटर आरेख / डायग्राम में बिंदुओं वितरण की स्थिति के आधार पर सहसंबंध को निम्न प्रकारों में समझा जा सकता है-

(i) सकारात्मक सहसंबंध (Positive Correlation)

    जब एक चर के बढ़ने पर दूसरा चर भी बढ़ता है, या एक चर के घटने पर दूसरा भी घटता है, तो उसे सकारात्मक सहसंबंध कहते हैं। स्कैटर डायग्राम में ऐसे बिंदु बाएँ से दाएँ ऊपर की ओर जाते हुए दिखाई देते हैं।

उदाहरण-

⇒ आय और उपभोग

⇒ वर्षा और कृषि उत्पादन

(ii) नकारात्मक सहसंबंध (Negative Correlation)

    जब एक चर के बढ़ने पर दूसरा चर घटता है, तो उसे नकारात्मक सहसंबंध कहते हैं। स्कैटर डायग्राम में बिंदु बाएँ से दाएँ नीचे की ओर ढलान बनाते हैं।

उदाहरण-

⇒ मूल्य और माँग

⇒ ऊँचाई और तापमान

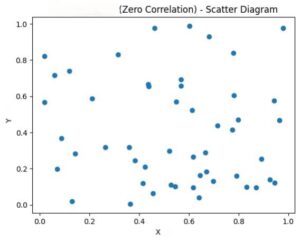
(iii) शून्य सहसंबंध (Zero Correlation)

    जब दो चरों के बीच कोई निश्चित संबंध नहीं होता, तो उसे शून्य सहसंबंध कहते हैं। स्कैटर डायग्राम में बिंदु अनियमित रूप से बिखरे होते हैं।
उदाहरण-

⇒ जूते का साइज और बुद्धि

⇒ जन्म-तिथि और परीक्षा-अंक

स्कैटर डायग्राम के लाभ

✍️ यह सहसंबंध को सरल और दृश्य रूप में प्रस्तुत करता है।

✍️ यह प्रारंभिक विश्लेषण के लिए अत्यंत उपयोगी है।

✍️ इसे बनाना और समझना आसान है।

✍️ यह आँकड़ों में किसी भी असामान्यता (Outlier) को स्पष्ट दिखा देता है।

✍️ यह आगे की सांख्यिकीय विधियों (जैसे Karl Pearson सहसंबंध) के लिए आधार प्रदान करता है।

सीमाएँ

    स्कैटर डायग्राम की निम्नलिखित सीमाएँ है-

✍️ यह सहसंबंध की सटीक मात्रा नहीं बताता।

✍️ बड़े आँकड़ों में बिंदु आपस में मिल जाते हैं, जिससे स्पष्टता कम हो जाती है।

✍️ यह केवल दो चरों के बीच संबंध दर्शा सकता है।

✍️ व्यक्तिगत व्याख्या (Subjective Interpretation) पर अधिक निर्भर करता है।

भूगोल एवं अन्य विषयों में उपयोग

   स्कैटर डायग्राम का प्रयोग भूगोल, अर्थशास्त्र, समाजशास्त्र, जनसंख्या अध्ययन, पर्यावरण अध्ययन आदि में व्यापक रूप से किया जाता है।

भूगोल में उपयोग जैसे-

  वर्षा और नदी प्रवाह, जनसंख्या घनत्व और संसाधन, तापमान और वनस्पति जैसे संबंधों को समझने के लिए स्कैटर डायग्राम अत्यंत उपयोगी है।

निष्कर्ष:

   अतः कहा जा सकता है कि सहसंबंध के अध्ययन में स्कैटर डायग्राम एक सरल, प्रभावी और उपयोगी ग्राफिकल विधि है। यह दो चरों के बीच संबंध की दिशा और प्रकृति को स्पष्ट रूप से दर्शाता है।

    यद्यपि इसकी कुछ सीमाएँ हैं, फिर भी प्रारंभिक विश्लेषण और शोध के लिए इसका महत्व अत्यधिक है। सांख्यिकी और भूगोल के विद्यार्थियों के लिए स्कैटर डायग्राम सहसंबंध को समझने का एक मजबूत आधार प्रदान करता है।

UG Regular Semester-V Examination 2025 QUESTION PAPER, Patliputra University, Patna

UG Regular Semester-V

Examination 2025

QUESTION PAPER


Patliputra University, Patna

UG Regular Semester-V

UG (Regular) (Sem.-V)

Examination, 2025

(Session: 2023-27)

(MJC-8: MAJOR CORE COURSE)

GEOGRAPHY

Paper Code: 410812

(Environmental Geography)

Time: Three Hours] [Maximum Marks: 70

Note: Candidates are required to give their answers in their own words as far as practicable. The figures in the margin indicate full marks. Answer from all sections as directed.

परीक्षार्थी यथासम्भव अपने शब्दों में ही उत्तर दें। उपांत के अंक पूर्णांक के द्योतक है। निर्देशानुसार सभी खण्डों से उत्तर दीजिए।

Section-A / खण्ड-अ

(Objective/Multiple Choice Questions)

(वस्तुनिष्ठ बहुविकल्पीय प्रश्न)

Note : Choose the correct option from each question. Each question carries 2 marks. [10×2=20]

प्रत्येक प्रश्न से सही विकल्प का चयन कीजिए। प्रत्येक प्रश्न 2 अंकों का है।

1. (i) Cartography is the study of:

(a) Stars and planets

(b) Making maps

(c) Rocks and minerals

(d) Earth’s atmosphere

मानचित्रकला एक अध्ययन है:

(a) तारों और ग्रहों का

(b) मानचित्र बनाने का

(c) चट्टानों और खनिजों का

(d) पृथ्वी के वायुमण्डल का

(ii) What is the main objective of Cartography?

(a) Creating artwork

(b) Analysing spatial data

(c) Determining Political Boundaries

(d) Studying Geological Processes

मानचित्रकला का मुख्य उद्देश्य क्या है?

(a) कलाकृति बनाना

(b) स्थानिक आंकड़ों के विश्लेषण करना

(c) राजनीतिक सीमाओं का निर्धारण करना

(d) भूवैज्ञानिक प्रक्रियाओं का अध्ययन करना

(iii) What is a scale in the context of maps and drawings?

(a) The size of the map or drawing

(b) The colours used for different features

(c) The ratio between a distance on a maр and corresponding distance on the ground

(d) A tool used to draw straight lines

मानचित्र या ड्राइंग के संदर्भ में पैमाना क्या है?

(a) मानचित्र या ड्राइंग का आकार

(b) विभिन्न विशेषताओं के लिए उपयोग किए जाने वाले रंग

(c) मानचित्र पर दूरी और जमीन पर उसी के अनुरूप दूरी के बीच का अनुपात

(d) सीधी रेखाएँ खींचने के लिए उपयोग किया जाने वाला एक उपकरण

(iv) What is the maximum number of units that can be shown using a simple scale?

(a) One

(b) Two

(c) Three

(d) Four

एक सरल मापनी का उपयोग करके अधिकतम कितनी इकाइयाँ दर्शायी जा सकती हैं?

(a) एक

(b) दो

(c) तीन

(d) चार

(v) Weather maps are used for what purposes?

(a) Predicting earthquakes

(b) Depicting weather conditions

(c) Showing planetary conditions

(d) Predicting volcanic activity

मौसम मानचित्र का उपयोग किस उद्देश्य लिए किया जाता है?

(a) भूकम्प की भविष्यवाणी के लिए

(b) मौसम की स्थिति दर्शाने के लिए

(c) ग्रहों की स्थिति दर्शाने के लिए

(d) ज्वालामुखी गतिविधि की भविष्यवाणी के लिए

(vi) What is the primary purpose of a weather balloon in modern meteorology?

(a) To measure rainfall

(b) To transit weather data from high altitudes

(c) Tо capture images of cloud formations

(d) To monitor ocean currents

आधुनिक मौसम विज्ञान में मौसम के गुब्बारे का प्राथमिक उद्देश्य क्या है?

(a) वर्षा को मापना

(b) उच्च ऊँचाई से मौसम आंकड़ों का पारगमन

(c) बादल बनने के चित्र लेना

(d) समुद्र की धाराओं की निगरानी करना

(vii) What is a Map Projection?

(a) A model of the earth on a flat surface

(b) A process of transferring a spherical surface to a flat surface

(c) A depiction of natural features on a Globe

(d) An imaginary line dividing the earth

मानचित्र प्रक्षेप क्या है?

(a) समतल सतह पर पृथ्वी का एक मॉडल

(b) गोलाकार सतह को एक समतल सतह पर स्थानांतरित करने की प्रक्रिया

(c) ग्लोब पर प्राकृतिक विशेषताओं का चित्रण

(d) पृथ्वी को विभाजित करने वाली एक काल्पनिक रेखा

(viii) Which of the following is a key characteristic of the cylindrical equal-area projection?

(a) The scale is true along all parallels

(b) The shape of the areas is preserved

(c) The area is preserved but shapes are distorted especially in higher latitudes

(d) It is primarily used for navigation

निम्नलिखित में से कौन-सी बेलनाकार समक्षेत्र प्रक्षेप की एक मुख्य विशेषता है?

(a) सभी अक्षांशों के साथ पैमाना सही होता है

(b) क्षेत्रों के आकार को संरक्षित किया जाता है

(c) क्षेत्रफल को संरक्षित किया जाता है, लेकिन आकार विकृत होते हैं खासकर उच्च अक्षांशों पर

(d) यह मुख्य रूप से नेविगेशन के लिए उपयोग किया जाता है

(ix) What is the primary purpose of a topographical map?

(a) To show political boundaries

(b) To represent three-dimensional features in the earth’s surface on a twodimensional map

(c) To show population density

(d) To indicate weather patterns

स्थलाकृतिक मानचित्र का प्राथमिक उद्देश्य क्या है?

(a) राजनीतिक सीमाओं को दर्शाना

(b) पृथ्वी की सतह की त्रि आयामी विशेषताओं को द्वि-आयामी मानचित्र पर दर्शाना

(c) जनसंख्या घनत्व दिखाना

(d) मौसम के प्रतिमान को इंगित करना

(x) What do closely spaced contour lines on a topographical map represent?

(a) gentle slopе

(b) steep slope

(c) ocean

(d) flat plain

स्थलाकृतिक मानचित्र पर पास-पास खींची गई समोच्च रेखाएँ क्या दर्शाती हैं?

(a) मंद ढलान

(b) खड़ी ढलान

(c) महासागर

(d) समतल मैदान

Section-B / खण्ड-ब

(Short Answer Type Questions)

(लघु उत्तरीय प्रश्न)

Note: Answer any four questions of the following. Each question carries 5 marks. [4×5=20]

निम्नलिखित में से किन्हीं चार प्रश्नों के उत्तर दीजिए। प्रत्येक प्रश्न 5 अंकों का है।

2. What is the meaning of Cartography?

मानचित्रकला का क्या अर्थ है?

3. What is the application of scale on a map?

मानचित्र पर पैमाने का क्या उपयोग है?

4. What is the difference between climate and weather?

जलवायु एवं मौसम में क्या अन्तर है?

5. Give the classification of map projections according to their construction method.

रचना-विधि के अनुसार मानचित्र प्रक्षेपों का वर्गीकरण बताइए।

6. On which principle conical projections are made?

शंक्वाकार प्रक्षेप किस सिद्धान्त पर बनाए जाते हैं?

7. What is a Topographical Map?

स्थलाकृतिक मानचित्र क्या है?

Section-C / खण्ड-स

(Long Answer Type Questions)

(दीर्घ उत्तरीय प्रश्न)

Note : Answer any three questions of the following. Each question carries 10 marks. [3×10=30]

निम्नलिखित में से किन्हीं तीन प्रश्नों के उत्तर दीजिए। प्रत्येक प्रश्न 10 अंकों का है।

8. What is the nature and scope of Cartography?

मानचित्रकला की प्रकृति और कार्यक्षेत्र क्या है?

9. Discuss the significance of Weather maps.

मौसम मानचित्रों के महत्व पर चर्चा कीजिए।

10. Discuss the concept and properties of map projection.

मानचित्र प्रक्षेप की अवधारणा और गुणों पर चर्चा कीजिए।

11. Explain the properties, limitations and uses of the cylindrical equal area projection.

बेलनाकार समक्षेत्र प्रक्षेप के गुणों, सीमाओं और उपयोगों की व्याख्या कीजिए।

12. What are the methods to study the Topographical maps?

स्थलाकृतिक मानचित्रों के अध्ययन की विधियाँ क्या है?


UG (Regular) (Sem.-V)

Examination, 2025

(Session: 2023-27)

(MJC-9: MAJOR CORE COURSE)

GEOGRAPHY

Paper Code: 410813

(Cartographic Techniques)

Time: Three Hours) [Maximum Marks: 70

Note: Candidates are required to give their answers in their own words as far as practicable. The figures in the margin indicate full marks. Answer from all sections as directed.

परीक्षार्थी यथासम्भव अपने शब्दों में ही उत्तर दें। उपांत के अंक पूर्णांक के द्योतक है। निर्देशानुसार सभी खण्डों से उत्तर दीजिए।

Section-A / खण्ड-अ

(Multiple Choice Questions)

(बहुविकल्पीय प्रश्न)

Note : Choose the correct option from each question : प्रत्येक प्रश्न से सही विकल्प का चयन कीजिए [10×2=20]

1. (i) Which of the following gases is mainly responsible for acid rain?

(a) Carbon dioxide

(b) Sulphur dioxide

(c) Oxygen

(d) Hydrogen

निम्नलिखित में से कौन-सी गैस अम्लीय वर्षा के लिए मुख्य रूप से जिम्मेदार है?

(a) कार्बन डाइऑक्साइड

(b) सल्फर डाइऑक्साइड

(c) ऑक्सीजन

(d) हाइड्रोजन

(ii) Biodiversity hotspot refers to:

(a) Area with low biodiversity

(b) Area rich in biodiversity and under threat

(c) Area with no human activity

(d) Desert region

जैव विविधता हॉटस्पॉट कहते हैं:

(a) कम जैव विविधता वाले क्षेत्र को

(b) अधिक जैव विविधता वाले और संकटग्रस्त क्षेत्र को

(c) बिना मानव गतिविधि वाले क्षेत्र को

(d) मरुस्थलीय क्षेत्र को

(iii) Which is not a Greenhouse Gas?

(a) Methane

(b) Water Vapour

(c) Nitrogen

(d) Carbon Dioxide

निम्नलिखित में से कौन-सी ग्रीनहाउस गैस नहीं है?

(a) मीथेन

(b) जलवाष्प

(c) नाइट्रोजन

(d) कार्बन डाइऑक्साइड

(iv) Joint Forest Management Programme (JFM) in India started in which year?

(a) 1985

(b) 1990

(c) 1995

(d) 2000

भारत में संयुक्त वन प्रबंधन कार्यक्रम (जे.एफ.एम.) किस वर्ष प्रारम्भ हुआ?

(a) 1985

(b) 1990

(c) 1995

(d) 2000

(v) Which of the following is a primary consumer in a food chain?

(a) Grass

(b) Deer

(c) Tiger

(d) Fungus

खाद्य श्रृंखला में निम्नलिखित में से कौन प्राथमिक उपभोक्ता है?

(a) घास

(b) हिरण

(c) बाघ

(d) फफूंदी

(vi) Whati’s the main cause of Urban Heat Islands?

(a) Tree plantation

(b) Use of Concrete and Asphalt

(c) Agriculture

(d) Water bodies

शहरी ताप द्वीप का मुख्य कारण क्या है?

(a) वृक्षारोपण

(b) कॅक्रीट और डामर का उपयोग

(c) कृषि

(d) जल निकाय

(vii) The term ‘Sustainable Development’ was popularized by which report?

(a) Kyoto Protocol

(b) Stockholm Report

(c) Brundtland Report

(d) Rio Declaration

‘सतत विकास’ शब्द को किस रिपोर्ट ने लोकप्रिय बनाया?

(a) क्योटो प्रोटोकॉल

(b) स्टॉकहोम रिपोर्ट

(c) बुंडलैंड रिपोर्ट

(d) रियो घोषणा

(viii) Which of the following is a Secondary Pollutant?

(a) Sulphur Dioxide

(b) Smog

(c) Lead

(d) Dust

निम्नलिखित में से कौन द्वितीयक प्रदूषक है?

(a) सल्फर डाइऑक्साइड

(b) धुंध

(c) सीसा

(d) धूल

(ix) Which is considered the largest ecosystem on Earth?

(a) Desert

(b) Grassland

(c) Ocean

(d) Forest

पृथ्वी का सबसे बड़ा पारिस्थितिकी-तंत्र कौन-सा है?

(a) मरुस्थल

(b) घास का मैदान

(c) महासागर

(d) वन

(x) Which of the following laws relates to controlling water pollution in India?

(a) Air (Prevention and Control of Pollution) Act

(b) Forest Conservation Act

(c) Water (Prevention and Control of Pollution) Act

(d) Wildlife Protection Act

निम्नलिखित में से कौन-सा कानून भारत में जल प्रदूषण को नियंत्रित करने से सम्बन्धित है?

(a) वायु (प्रदूषण की रोकथाम और नियंत्रण) अधिनियम

(b) वन संरक्षण अधिनियम

(c) जल (प्रदूषण की रोकथाम और नियंत्रण) अधिनियम

(d) वन्यजीव संरक्षण अधिनियम

Section-B / खण्ड-ब

(Short Answer Type Questions)

(लघु उत्तरीय प्रश्न)

Note: Answer any four questions of the following. [4×5=20]

निम्नलिखित में से किन्हीं चार प्रश्नों के उत्तर दीजिए।

2. Define ‘Environmental Geography’. Name two components of the environment.

‘पर्यावरण भूगोल’ क्या है? पर्यावरण के दो घटकों के नाम लिखिए।

3. What is Biodiversity Hotspot?

जैवविविधता हॉटस्पॉट क्या है?

4. What is meant by the Ecological Balance?

प्रारिस्थितिक संतुलन से आप क्या समझते हैं?

5. What is the main cause of heat Islands in Cities?

शहरों में ताप द्वीप का मुख्य कारण क्या है?

6. Explain any two types of Environmental Crisis.

पर्यावरणीय संकट के कोई दो प्रकार स्पष्ट कीजिए।

7. Write a short note on the management of Sewage Disposal.

मल-निष्कासन व्यवस्था के प्रबंधन पर संक्षिप्त टिप्पणी लिखिए।

Section-C / खण्ड-स

(Long Answer Type Questions)

(दीर्घ उत्तरीय प्रश्न)

Note: Answer any three questions of the following. [3×10=30]

निम्नलिखित में से किन्हीं तीन प्रश्नों के उत्तर दीजिए।

8. Examine the concepts and components of the Ecosystem, explaining their interrelationship with suitable examples.

पारिस्थितिकी-तंत्र की संकल्पना एवं घटकों की परस्परता, उपयुक्त उदाहरणों सहित स्पष्ट कीजिए।

9. Critically analyze the causes and impact of environmental degradation, citing recent events in India.

पर्यावरणीय क्षरण के कारण व प्रभावों को आलोचनात्मक विवेचना, भारत की ताज़ा घटनाओं सहित कीजिए।

10. Discuss the various types of Environmental Pollution and their remedial measures in detail.

पर्यावरण प्रदूषण के विभिन्न प्रकार एवं उनके उपचारात्मक उपायों का वर्णन कीजिए।

11. Assess the role of environmental management policies in mitigating disasters such as floods and droughts.

आपदाओं जैसे-बाढ़ एवं सूखे में आपदा प्रबंधन नीतियों की भूमिका

12. Explain natural hazards and environmental laws, with reference to radiation hazards, gas leaks, and acid rain

प्राकृतिक आपदाएँ एवं पर्यावरणीय कानून विकिरण आपदा, गैस रिसाव, अम्लीय वर्षा के संदर्भ में समझाइए।
UG Minor Core Course or MIC-5 Human Geography (Theory) Questions Paper 2025 (Patliputra University Patna)

UG Minor Core Course or MIC-5

Human Geography (Theory)

Questions Paper 2025


(Patliputra University Patna)

UG Minor Core Course or MIC-5

UG (Regular) (Sem.-V)

Examination, 2025

(Session : 2023-27)

(MIC-5: MINOR CORE COURSE)

GEOGRAPHY

Paper Code : 420809

(Human Geography)

Time: Three Hours] [Maximum Marks: 70

Note: Candidates are required to give their answers in their own words as far as practicable. The figures in the margin indicate full marks. Answer from all parts as directed.

परीक्षार्थी यथासम्भव अपने शब्दों में ही उत्तर दें। उपांत के अंक पूर्णांक के द्योतक हैं। निर्देशानुसार सभी भागों से उत्तर दीजिए।

Part-A / भाग-अ

(Multiple Choice Questions)

(बहुविकल्पीय प्रश्न)

Note: Choose the correct option from each question:

प्रत्येक प्रश्न से सही विकल्प का चयन कीजिए [10×2=20]

1. (i) The Demographic Transition Model (DTM) describes the transition of a population from:

(a) High birth and high death rates to low birth and low death rates

(b) High birth and low death rates to low birth and high death rates

(c) Low birth rates and high death rates to high birth rates and high death rates

(d) Zero population growth to population decline

जनसांख्यिकी संक्रमण मॉडल (डीटीएम) जनसंख्या के संक्रमण का वर्णन करता है:

(a) उच्च जन्म और उच्च मृत्यु दर से निम्न जन्म और निम्न मृत्यु दर तक

(b) उच्च जन्म और निम्न मृत्यु दर से निम्न जन्म और उच्च मृत्यु दर तक

(c) निम्न जन्म दर और उच्च मृत्यु दर से उच्च जन्म दर और उच्च मृत्यु दर तक

(d) शून्य जनसंख्या वृद्धि से जनसंख्या में गिरावट तक

(ii) Which of the following regions has the highest population growth rate currently?

(a) Europe

(b) North America

(c) Sub-Saharan Africa

(d) East Asia

वर्तमान में निम्नलिखित में से किस क्षेत्र की जनसंख्या वृद्धि दर सबसे अधिक है?

(a) यूरोप

(b) उत्तरी अमेरिका

(c) उप-सहारा अफ्रीका

(d) पूर्वी एशिया

(iii) Population distribution is most influenced by which of the following factors?

(a) Economic development and access to education

(b) Climate and geographic features

(c) Political boundaries

(d) Religious and cultural affiliations

जनसंख्या वितरण निम्नलिखित में से किस कारक से सबसे अधिक प्रभावित होता है?

(a) आर्थिक विकास और शिक्षा तक पहुँच

(b) जलवायु और भौगोलिक विशेषताएँ

(c) राजनीतिक सीमाएँ

(d) धार्मिक और सांस्कृतिक सम्बद्धताएँ

(iv) Which of the following is a characteristic of forced migration?

(a) Voluntary movement based on economic opportunity

(b) Movement due to social or political factors such as war or persecution

(c) Migration for educational purposes

(d) Migration influenced by environmental changes like climate

निम्नलिखित में से कौन-सी जबरन प्रवास की विशेषता है?

(a) आर्थिक अवसर पर आधारित स्वैच्छिक प्रवास

(b) युद्ध या उत्पीड़न जैसे सामाजिक या राजनीतिक कारकों के कारण प्रवास

(c) शैक्षिक उद्देश्यों के लिए प्रवास

(d) जलवायु जैसे पर्यावरणीय परिवर्तनों से प्रभावित प्रवास

Which of the following best describes “urbanization”?

(a) The movement of people from rural areas to urban areas

(b) The movement of people from urban areas to rural areas

(c) The decline in population in both rural and urban areas

(d) The increase in population growth in rural areas

निम्नलिखित में से कौन-सा “शहरीकरण” का सबसे अच्छा वर्णन करता है?

(a) ग्रामीण क्षेत्रों से शहरी क्षेत्रों की ओर लोगों का आवागमन

(b) शहरी क्षेत्रों से ग्रामीण क्षेत्रों की ओर लोगों का आवागमन

(c) ग्रामीण और शहरी दोनों क्षेत्रों में जनसंख्या में गिरावट

(d) ग्रामीण क्षेत्रों में जनसंख्या वृद्धि दर में वृद्धि

(vi) Which of the following is a characteristic of a dispersed rural settlement?

(a) High density of houses close together

(b) Houses scattered over a wide area

(c) Settlements clustered around a market

(d) Linear arrangements along roads

निम्नलिखित में से कौन-सी एक बिखरी हुई ग्रामीण बस्ती की विशेषता है?

(a) एक दूसरे के करीब स्थित घरों का उच्च घनत्व

(b) विस्तृत क्षेत्र में फैले हुए घर

(c) बाजार के चारों ओर बसी बस्तियाँ

(d) सड़कों के किनारे रैखिक व्यवस्था

(vii) Urban settlements are often classified based on their main function. Which of the following is not a typical urban settlement function?

(a) Administrative

(b) Defence

(c) Fishing Village

(d) Industrial

शहरी बस्तियों को अक्सर उनके मुख्य कार्य के आधार पर वर्गीकृत किया जाता है। निम्नलिखित में से कौन-सा शहरी बस्तियों का विशिष्ट कार्य नहीं है?

(a) प्रशासनिक

(b) रक्षा

(c) मछली पकड़ने वाला गाँव

(d) औद्योगिक

(viii) A compact pattern of rural settlement is most likely found in areas with:

(a) Scarce Water

(b) Fertile Plains

(c) Steep Slope

(d) Dense Forest

ग्रामीण बस्तियों का एक सघन पैटर्न संभवतः निम्नलिखित क्षेत्रों में पाया जाता है:

(a) दुर्लभ जल

(b) उपजाऊ मैदान

(c) खड़ी ढलान

(d) घना जंगल

(ix) A ‘hamlet’ refers to:

(a) A Small rural Community

(b) A large Urban Centre

(c) An Industrial Town

(d) A Suburban Area

‘हैमलेट’ का तात्पर्य है:

(a) एक छोटा ग्रामीण समुदाय

(b) एक बड़ा शहरी केंद्र

(c) एक औद्योगिक शहर

(d) एक उपनगरीय क्षेत्र

(x) Which factor does not influence the site of a settlement?

(a) Relief

(b) Water Availability

(c) Soil Quality

(d) Neighbourhood

कौन-सा कारक किसी बस्ती के स्थल को प्रभावित नहीं करता है?

(a) भू-आकृति

(b) जल उपलब्धता

(c) मृदा गुणवत्ता

(d) आस-पड़ोस

Part-B / भाग-ब

(Short Answer Type Questions)

(लघु उत्तरीय प्रश्न)

Note: Answer any four questions of the following: [4×5=20]

निम्नलिखित में से किन्हीं चार प्रश्नों के उत्तर दीजिए :

2. Define Human Geography. Discuss its nature and scope with suitable examples.

मानव भूगोल की परिभाषा दीजिए। इसके स्वरूप और क्षेत्र का वर्णन उदाहरण सहित कीजिए।

3. Explain the concept of Determinism in Human Geography. Give examples to support your answer.

मानव भूगोल में निश्चयवाद की अवधारणा स्पष्ट कीजिए। अपने उत्तर की पुष्टि उदाहरण देकर कीजिए।

4. Explain the main components of population composition and their significance in human geography.

जनसंख्या संरचना के प्रमुख घटकों और मानव भूगोल में उनके महत्व की व्याख्या कीजिए।

5. Explain the stages of the Demographic Transition Theory and relate them to development.

जनसांख्यिकीय संक्रमण सिद्धान्त की अवस्थाओं की व्याख्या कीजिए और उन्हें विकास से जोड़िए।

6. Classify the main types of rural settlement patterns and explain their spatial characteristics.

ग्रामीण बस्ती के प्रमुख प्रतिरूपों का वर्गीकरण कीजिए तथा उनके स्थानिक गुणों का वर्णन कीजिए।

7. On what basis are urban settlements classified in India? Give examples of each type.

भारत में नगरीय बस्तियों का वर्गीकरण किन आधारों पर किया जाता है? प्रत्येक प्रकार का उदाहरण दीजिए।

Part-C / भाग-स

(Long Answer Type Questions)

(दीर्घ उत्तरीय प्रश्न)

Note: Answer any three questions of the following: [3×10=30]

निम्नलिखित में से किन्हीं तीन प्रश्नों के उत्तर दीजिए:

8. Explain the trends and patterns of population growth in the world since 1900. Discuss factors responsible for spatial and temporal variations in growth rates.

1900 के बाद विश्व में जनसंख्या वृद्धि के रुझानों और प्रतिरूपों की व्याख्या कीजिए। वृद्धि दरों में स्थानिक तथा कालिक विभिन्नताओं के कारणों पर वर्णन कीजिए।

9. Describe the basis of classification of urban settlements in India and describe the functional categories of towns and cities with suitable examples.

भारत में नगरीय बस्तियों के वर्गीकरण के आधारों का वर्णन कीजिए तथा उपयुक्त उदाहरणों सहित शहरों और कस्बों के कार्यात्मक वर्गों का वर्णन कीजिए।

10. Explain the major types of settlement patterns found in rural areas. Discuss the physical and socio-economic factors responsible for their formation.

ग्रामीण क्षेत्रों में पाई जाने वाली प्रमुख बस्ती प्रतिरूपों की व्याख्या कीजिए। इनके निर्माण के लिए जिम्मेदार भौतिक तथा सामाजिक-आर्थिक कारकों पर चर्चा कीजिए।

11. Explain the causes of migration and analyse its social, economic, and environmental consequences on both source and destination areas.

प्रवासन के कारणों की व्याख्या कीजिए और प्रेषक (स्रोत) तथा गंतव्य (जाने वाले क्षेत्र) क्षेत्रों पर इसके सामाजिक, आर्थिक और पर्यावरणीय प्रभावों का विश्लेषण कीजिए।

12. Describe the Demographic Transition Theory in detail. How does it help to explain the relationship between population growth and economic development?

जनसांख्यिकीय संक्रमण सिद्धान्त का विस्तारपूर्वक वर्णन कीजिए। यह सिद्धान्त जनसंख्या वृद्धि और आर्थिक विकास के सम्बन्ध को कैसे स्पष्ट करता है?


UG (Regular) (Sem.-V)

Examination, 2025

(Session: 2023-27)

(MIC-6: MINOR CORE COURSE)

GEOGRAPHY

Paper Code : 420810

(Geography of India and Bihar)

Time: Three Hours] [Maximum Marks : 70

Note: Candidates are required to give their answers in their own words as far as practicable. The figures in the margin indicate full marks. Answer from all the parts as directed.

परीक्षार्थी यथासंभव उत्तर अपने शब्दों में ही दें। उपांत के अंक पूर्णांक के द्योतक हैं। निर्देशानुसार सभी भागों से प्रश्नों के उत्तर दीजिए।

PART-A / भाग-अ

(Objective Type Questions)

(वस्तुनिष्ठ प्रश्न)

Note : Attempt all Multiple choice question from this part.

Each question carries 2 marks. [10×2=20]

इस भाग से सभी बहुविकल्पीय प्रश्नों को हल कीजिए। प्रत्येक प्रश्न 2 अंक का है।

1. (i) The Northern Plains of India are mainly formed by which process?

(a) Volcanic activity

(b) Alluvial deposition

(c) Tectonic uplift

(d) Wind erosion

भारत के उत्तरी मैदान मुख्यतः किस प्रक्रिया से बने हैं?

(a) ज्वालामुखीय क्रिया

(b) जलोढ़ निक्षेपण

(c) भू-तापीय उत्थान

(d) पवन अपरदन

(ii) Which of the following rivers is a Peninsular River?

(a) Ganga

(b) Yamuna

(c) Godavari

(d) Ghaghara

निम्नलिखित में कौन-सी एक प्रायद्वीपीय नदी है?

(a) गंगा

(b) यमुना

(c) गोदावरी

(d) घाघरा

(iii) The main cause of monsoon in India is:

(a) Westerlies

(b) Trade winds and differential heating

(c) Sea breeze

(d) Local winds

भारत में मानसून का मुख्य कारण क्या है?

(a) पश्चिमी पवनें

(b) व्यापारिक पवनें और भिन्न तापन

(c) समुद्री हवा

(d) स्थानीय पवनें

(iv) Which type of soil covers the largest area in India?

(a) Red soil

(b) Black soil

(c) Alluvial soil

(d) Laterite soil

भारत में कौन-सी मिट्टी सबसे बड़े क्षेत्र में पाई जाती है?

(a) लाल मिट्टी

(b) काली मिट्टी कपाल

(c) जलोढ़ मिट्टी

(d) लेटराइट मिट्टी

(v) Tropical evergreen forests are mainly found in:

(a) Western Ghats

(b) Thar Desert

(c) Gangetic Plain

(d) Ladakh

सदाबहार वन मुख्यतः कहाँ पाए जाते हैं:

(a) पश्चिमी घाट

(b) थार मरुस्थल

(c) गंगीय मैदान

(d) लदाख

(vi) Which state is the largest producer of jute in India?

(a) Bihar

(b) Assam

(c) West Bengal

(d) Odisha

भारत में जूट का सबसे बड़ा उत्पादक राज्य कौन-सा है?

(a) बिहार

(b) असम

(c) पश्चिम बंगाल

(d) ओडिसा

(vii) The sugar industry in India is mainly located in:

(a) Punjab

(b) Maharashtra and Uttar Pradesh

(c) Tamil Nadu

(d) Gujarat

भारत में चीनी उद्योग मुख्यतः कहाँ स्थित है?

(a) पंजाब

(b) महाराष्ट्र और उत्तर प्रदेश

(c) तमिलनाडु

(d) गुजरात

(viii) The North Bihar plain is frequently affected by:

(a) Earthquake

(b) Flood

(c) Drought

(d) Landslide

उत्तर बिहार का मैदान प्रायः किससे प्रभावित रहता है?

(a) भूकम्प

(b) बाढ़

(c) सूखा

(d) भूस्खलन

(ix) Which of the following rivers flows through Bihar?

(a) Krishna

(b) Mahanadi

(c) Kosi

(d) Godavari

निम्नलिखित में से कौन-सी नदी बिहार से होकर बहती है?

(a) कृष्णा

(b) महानदी

(c) कोसी

(d) गोदावरी

(x) The physiography of Bihar mainly consists of:

(a) Plateau and Desert

(b) Northern plains and Southern plateau

(c) Coastal plain

(d) Hill ranges only

बिहार की भौतिक संरचना मुख्यतः किन भागों से मिलकर बनी है:

(a) पठार और मरुस्थल

(b) उत्तरी मैदान और दक्षिणी पठार

(c) तटीय मैदान

(d) केवल पर्वत श्रृंखलाएँ

PART-B / भाग-ब

(Short Answer Type Questions)

(लघु उत्तरीय प्रश्न)

Note : Answer any four questions. Each question carries 5 marks. [4×5=20]

निम्नलिखित में से किन्हीं चार प्रश्नों के उत्तर दीजिए। प्रत्येक प्रश्न 5 अंकों का है।

2. Describe the main physiographic divisions of India.

भारत के प्रमुख भौतिक (स्थलाकृतिक) विभाजनों का वर्णन कीजिए।

3. Compare the characteristics of Himalayan and Peninsular rivers.

हिमालयी और प्रायद्वीपीय नदियों की विशेषताओं की तुलना कीजिए।

4. Explain the origin and mechanism of the Indian monsoon.

भारतीय मानसून की उत्पत्ति और तंत्र (प्रक्रिया) की व्याख्या कीजिए।

5. Write a short note on the types and distribution of soils in India.

भारत में मिट्टियों के प्रकार और वितरण पर संक्षिप्त टिप्पणी लिखिए।

6. Discuss the geographical factors responsible for the growth of the sugar industry in India.

भारत में चीनी उद्योग के विकास के लिए उत्तरदायी भौगोलिक कारकों पर चर्चा कीजिए।

7. Describe the structure and physiography of Bihar and its impact on agriculture.

बिहार की संरचना और भौगोलिक बनावट का वर्णन कीजिए तथा कृषि पर इसके प्रभाव को स्पष्ट कीजिए।

PART-C/ भाग-स

(Long Answer Type Questions)

(दीर्घ उत्तरीय प्रश्न)

Note: Answer any three questions. Each question carries 10 marks. [3×10=30]

निम्नलिखित में से किन्हीं तीन प्रश्नों के उत्तर दीजिए। प्रत्येक प्रश्न 10 अंकों का है।

8. Describe in detail the relief and geological structure of India. How do these physical features influence the distribution of population and economic activities?

भारत की उच्चावच और भूवैज्ञानिक संरचना का विस्तार से वर्णन कीजिए। ये भौतिक विशेषताएँ जनसंख्या वितरण और आर्थिक गतिविधियों को किस प्रकार प्रभावित करती हैं?

9. Discuss the origin, mechanism and characteristics of the Indian monsoon. Explain its importance for Indian agriculture?

भारतीय मानसून की उत्पत्ति, क्रियाविधि और विशेषताओं पर चर्चा कीजिए। भारतीय कृषि के लिए इसके महत्व को स्पष्ट कीजिए।

10. Explain the different types of natural vegetation found in India and the factors responsible for their distribution.

भारत में पाई जाने वाली विभिन्न प्रकार की प्राकृतिक वनस्पतियों तथा उनके वितरण के लिए उत्तरदायी कारकों की व्याख्या कीजिए।

11. Describe the Sugar and Paper agricultural industries of India. Discuss the geographical conditions required for their growth and development.

भारत के चीनी और कागज कृषि उद्योगों का वर्णन कीजिए। इनके विकास और वृद्धि के लिए आवश्यक भौगोलिक परिस्थितियों पर चर्चा कीजिए।

14. Correlation analysis (सहसंबंध विश्लेषण)

Correlation analysis

(सहसंबंध विश्लेषण)


⇒ Correlation analysis deals with the association between two or more Variables.

⇒ The degree of relationship between the Variables Under consideration is measured through the correlation analysis.

⇒ The measure of correlation called the “Correlation coefficient or correlation index” Summarizes in Figure the direction & degree one of correlation.

Example1

x⇑ y⇑
10 15
12 20
15 22
18 25
20 37
25 43

👉  ऊपर दिए गए आँकड़ों में x और y के मानों को देखने पर स्पष्ट होता है कि जैसे-जैसे x का मान बढ़ता है, वैसे-वैसे y का मान भी बढ़ रहा है।

👉  अर्थात्, x में वृद्धि होने पर y में भी वृद्धि की प्रवृत्ति दिखाई देती है, जिससे दोनों चर आपस में सकारात्मक रूप से संबंधित हैं।

👉 यहाँ x और y के बीच धनात्मक (Positive) सहसंबंध है।

Example2

x⇑ y⇓
20 40
30 30
40 22
50 15
60 10
80 4

👉  दिए गए आँकड़ों में जैसे-जैसे x का मान बढ़ता है, वैसे-वैसे y का मान घटता जाता है

👉  अतः x और y के बीच नकारात्मक (ऋणात्मक) सहसंबंध पाया जाता है।

👉  चूँकि परिवर्तन नियमित और स्पष्ट है, इसलिए यह प्रबल नकारात्मक सहसंबंध (Strong Negative Correlation) को दर्शाता है।

Type of Correlation

1. Positive Correlation (Direct Correlation):-

   If both the Variable in Same direction. x⇑, y⇑ or x⇓, y⇓ e.g., Height & Weight, Rainfall & Yeild

2. Negative Correlation (Inverse Correlation):-

    If both the variables Varies in opposite direction. x⇑, y⇓ or x⇓, y⇑ e.g., Price & Demand

3. Zero Correlation (No Correlation):-

      When there is no relationship between variables. or When one variable changes, the other variable does not change in any consistent way. x⇑⇓, y or x, y⇑⇓ e.g., Shoe size & intelligence

Correlation Coefficient (r)

     The correlation coefficient is a statistical measure that shows the strength and direction of the relationship between two variables. Its value ranges from −1 to +1, where positive values indicate direct correlation, negative values indicate inverse correlation, and zero indicates no relationship.

r = +1 ⇒ Perfect Positive Correlation,

r = -1 ⇒ Perfect Negative Correlation,

r = 0 ⇒ No Relation,

r = 0.8, 0.9, 0.95 अर्थात जब r का Value 1 के करीब आता है तो उसे Strong +ve Correlation कहा जाता है।

r = -0.85, -0.9, -0.95 अर्थात जब r का Value लगभग -1 के करीब आता है तो उसे Strong Negative Correlation कहा जाता है।

Method of Finding Correlation Coefficient (r)

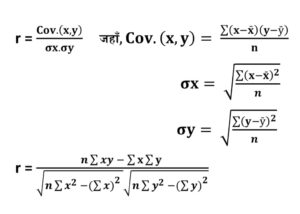
          The correlation coefficient (r) is found using several methods. The Karl Pearson’s method is the most common, where r is calculated by dividing the covariance of two variables by the product of their standard deviations.

     The Spearman’s rank correlation method is used when data are ranked or not normally distributed.

    Another method is the concurrent deviations method, suitable for time-series data showing direction of change.

             Scatter diagram method finds correlation coefficient (r) by plotting paired data points, observing pattern direction, and estimating strength visually.

   These methods help measure the degree and direction of relationship between variables, with values of r ranging from –1 to +1.

1. Karl Pearson’s method

2. Spearman’s rank correlation method

3. Concurrent deviations method

4. Scatter diagram method

1. Karl Pearson’s Product Moment Method

      Karl Pearson’s Product Moment Method measures the degree and direction of linear relationship between two quantitative variables. It uses covariance divided by the product of their standard deviations, producing a correlation coefficient (r) ranging from –1 to +1, indicating negative, positive, or no correlation.


Ex. (i) Find coefficient of correlation of the following data.

x y
9 15
8 16
7 14
6 13
5 11
4 12
3 10
2 8
1 9

Solution:

x y x2 y2 xy
9 15 81 225 135
8 16 64 256 128
7 14 49 196 98
6 13 36 169 78
5 11 25 121 55
4 12 16 144 48
3 10 9 100 30
2 8 4 64 16
1 9 1 81 9
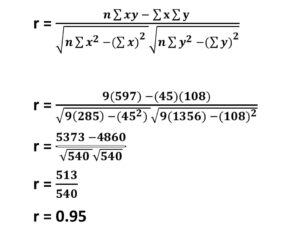
Total sum = 45 108 285 1356 597

n = No. of pair of observers

n = 9

Σxy = 597

Σx = 45

Σy = 108

Σx2 = 285

Σy2 = 1356

Correlation analysis

UG MIC1 Geography Examination 2025 Patliputra University, Patna

UG MIC1 Geography Examination 2025 

Patliputra University, Patna


UG MIC1 Geography Examination 2025 

UG (Regular) (Sem.-I) Examination, 2025

(Session: 2025-29)

(MIC-1: MINOR CORE COURSE)

GEOGRAPHY

Paper Code : 420801

(Geomorphology)

Time: Three Hours] [Maximum Marks: 70

Note: Candidates are required to give their answers in their own words as far as practicable. The figures in the margin indicate full marks. Answer from all sections as directed.

परीक्षार्थी यथासम्भव अपने शब्दों में ही उत्तर दें। उपांत के अंक पूर्णांक के द्योतक हैं। निर्देशानुसार सभी खण्डों से उत्तर दीजिए।

Section-A / खण्ड-अ

(Objective Type Questions)

(वस्तुनिष्ठ प्रश्न)

Note : Choose the correct option from each question:

1. प्रत्येक प्रश्न से सही विकल्प का चयन कीजिए: [10×2=20]

(i) Who proposed the Gaseous Hypothesis of the origin of the Earth?

(a) Immanuel Kant

(b) Pierre-Simon Laplace

(c) George Buffon

(d) James Jeans

पृथ्वी की उत्पत्ति की गैसीय परिकल्पना किसने प्रतिपादित की?

(a) इमैनुअल कांट

(b) पियरे साइमन लाप्लास

(c) जॉर्ज बफन

(d) जेम्स जीन्स

(ii) The boundary between the crust and the mantle is known as

(a) Gutenberg Discontinuity

(b) Mohorovicic Discontinuity

(c) Conrad Discontinuity

(d) Lehmann Discontinuity

भूपटल और मेंटल के बीच की सीमा को क्या कहा जाता है?

(a) गुटेनबर्ग विस्मयता

(b) मोहोरोविकिक विस्मयता

(c) कॉनराड विस्मयता

(d) लेहमैन विस्मयता

(iii) Which waves cannot pass through the Earth’s outer core?

(a) S-waves

(b) P-waves

(c) Surface waves

(d) Both (a) and (b)

पृथ्वी की बाह्य कोर से कौन-सी तरंगे नहीं गुजर सकती?

(a) एस-तरंगे

(b) पी-तरंगे

(c) सतही तरंगे

(d) दोनों (a) और (b)

(iv) Which of the following is not true about seismic waves?

(a) P-waves can pass through solids, liquids, and gases

(b) S-waves can travel only through solids

(c) P-waves travel slower than S-waves

(d) The speed of seismic waves increases with depth in the mantle

निम्नलिखित में से कौन-सा कथन भूकंपीय तरंगों के बारे में सही नहीं है?

(a) पी-तरंगे ठोस, द्रव और गैसों से गुजर सकती हैं

(b) एस-तरंगे केवल ठोस माध्यमों से यात्रा कर सकती हैं

(c) पी-तरंगें एस-तरंगों से धीमी गति से चलती हैं

(d) मेंटल की गहराई के साथ भूकंपीय तरंगों की गति बढ़ती है

(v) Which of the following is an endogenic geomorphic process?

(a) Weathering

(b) Deposition

(c) Erosion

(d) Earthquake

निम्नलिखित में से कौन-सी एक अंतर्जात भू-पृष्ठीय प्रक्रिया है?

(a) अपक्षय

(b) निक्षेपण

(c) कटाव

(d) भूकंप

(vi) Which rock is formed from the cooling of lava on the Earth’s surface?

(a) Basalt

(b) Marble

(c) Gneiss

(d) Shale

पृथ्वी की सतह पर लावा के ठंडा होने से बनी शिला कौन-सी है?

(a) बेसाल्ट

(b) संगमरमर

(c) ग्नाइस/ग्निस

(d) शेल

(vii) The process of formation of landforms due to internal forces is known as:

(a) Denudation

(b) Gradation

(c) Diastrophism

(d) Mass wasting

आंतरिक बलों द्वारा स्थल के निर्माण की प्रक्रिया को कहते हैं:

(a) अनाच्छादन

(b) समकोटिकरण

(c) पटलविरूपण

(d) गुरुत्वीय ढलान क्रिया

(viii) Gully erosion is most commonly associated with:

(a) Glacial movement

(b) Deflation

(c) Running water

(d) Earthquakes

गली अपरदन सामान्यतः किससे जुड़ा होता है?

(a) हिमानी संचलन

(b) अपक्षारण

(c) बहता जल

(d) भूकम्प

(ix) The Benioff Zone is associated with:

(a) Volcanic arcs at divergent margins

(b) Earthquake zones at subduction boundaries

(c) Mantle plume zones

(d) Sea-floor spreading centres

बेनिऑफ जोन किससे सम्बन्धित है?

(a) डायवर्जेंट सीमाओं पर ज्वालामुखी चाप

(b) सबडक्शन सीमाओं पर भूकंपीय क्षेत्र

(c) मेंटल प्लूम क्षेत्र

(d) समुद्र तल प्रसारण केन्द्र

(x) Which volcanic landforms results from a collapsed magma chamber after a major eruption?

(a) Composite cone

(b) Lava dome

(c) Shield volcano

(d) Caldera

प्रचंड विस्फोट के बाद मैग्मा चैंबर के ढहने से बनने वाली आकृति है:

(a) मिश्रित शंकु

(b) लावा गुंबद

(c) शील्ड ज्वालामुखी

(d) काल्डेरा

Section-B / खण्ड-ब

(Short Answer Type Questions)

(लघु उत्तरीय प्रश्न)

Note: Answer any four questions of the following: [4×5=20]

निम्नलिखित में से किन्हीं चार प्रश्नों के उत्तर दीजिए

2. Describe the internal structure of the Earth with a labelled diagram.

पृथ्वी की आंतरिक संरचना का संक्षिप्त वर्णन कीजिए।

3. What is the Gaseous Hypothesis regarding the origin of the Earth? Explain its main features.

पृथ्वी की उत्पत्ति से सम्बन्धित गैसीय परिकल्पना क्या है? इसके मुख्य विशेषताओं की व्याख्या कीजिए।

4. How are Sedimentary rocks formed? Give examples.

अवसादी चट्टानें कैसे बनती हैं? उदाहरण सहित समझाइए।

5. Differentiate between intrusive and extrusive volcanic
landforms with examples.

उदाहरण सहित अंतःनवनीय और बहिःनवनीय ज्वालामुखी स्थलरूपों में अन्तर स्पष्ट कीजिए।
6. What are Earthquakes? Describe their causes and types.

भूकम्प क्या है? इनके कारणों एवं प्रकारों का वर्णन कीजिए।

7. Differentiate between convergent, divergent and transform plate boundaries with suitable diagrams.

उचित आरेखों सहित अभिसारी, अपसारी और रूपांतरण प्लेट सीमाओं में अन्तर स्पष्ट कीजिए।

Section-C / खण्ड-स

(Long Answer Type Questions)

(दीर्घ उत्तरीय प्रश्न)

Note: Answer any three questions of the following: [3×10=30]

निम्नलिखित में से किन्हीं तीन प्रश्नों के उत्तर दीजिए:

8. Explain the Binary Star hypothesis about the origin of the Earth and the solar system.

पृथ्वी और सौरमंडल की उत्पत्ति के बारे में द्वितारा परिकल्पना की व्याख्या कीजिए।

9. What is Weathering? Describe the different types of weathering with suitable examples.

अपक्षय क्या है? अपक्षय के विभिन्न प्रकारों को उदाहरण सहित समझाइए।

10.What is a Volcano? Describe the types of volcanoes based on eruption style.

ज्वालामुखी क्या होता है? उद्गार शैली के आधार पर ज्वालामुखियों के प्रकारों को समझाइए।

11. Explain the major erosional landforms formed by the wind.

पवन द्वारा निर्मित अपरदनकारी भू-आकृतियों की व्याख्या कीजिए।

12. What is the Plate Tectonics theory? Explain its major features.

प्लेट विवर्तनिकी सिद्धान्त क्या है? इसकी मुख्य विशेषताओं की व्याख्या कीजिए। 

UG Regular Semester-I Examination 2025 Patliputra University, Patna QUESTION PAPER

UG Regular Semester-I Examination 2025

Patliputra University, Patna

QUESTION PAPER


UG Regular Semester-I Examination 2025

(Major Core Course or MJC-1)

(Session: 2025-29)

Paper Code : 410801

Geomorphology (Theory)

Time: Three Hours] [Maximum Marks: 70

Note : Candidates are required to give their answers in their own words as far as practicable. The figures in the margin indicate full marks. Answer from all the sections as directed.

परीक्षार्थी यथासंभव अपने शब्दों में ही उत्तर दें। उपांत के अंक पूर्णांक के द्योतक हैं। निर्देशानुसार सभी खण्डों से उत्तर दें।

Section-A / खंड -अ

(Objective Type Questions)

(वस्तुनिष्ठ प्रश्न)

Note : Attempt all Multiple choice questions from this part. Each question carries 2 marks. [10×2=20]

इस भाग से सभी बहुविकल्पीय प्रश्नों को हल कीजिए। प्रत्येक प्रश्न 2 अंक का है।

1. Choose the correct option from each question:

प्रत्येक प्रश्न से सही विकल्प का चयन कीजिए:

(i) Which is the outermost layer of the Earth?

(a) Mantle

(b) Core
(c) Crust

(d) Lithosphere

पृथ्वी की सबसे बाहरी परत कौन-सी है?

(a) मेंटल

(b) कोर

(c) क्रस्ट

(d) स्थलमंडल

(ii) What does the Big Bang Theory explain:

(a) The end ofthe universe

(b) The structure of the Earth

(c) The origin of the universe

(d) The movement of galaxies

बिग बैंग सिद्धान्त किसकी व्याख्या करता है?

(a) ब्राह्मांड का अंत

(b) पृथ्वी का संरचना

(c) ब्रह्मांड की उत्पत्ति

(d) आकाशगंगाओं की गति

(iii) Which layer of the Earth is broken into tectonic plates?

(a) Inner Core

(b) Asthenosphere

(c) Lithosphere

(d) Mantle

पृथ्वी की कौन-सी परत विवर्तनिक प्लेटों में विभाजित होती है?

(a) आंतरिक कोर

(b) एस्थेनोस्फीयर

(c) स्थलमंडल

(d) मेंटल

(iv) The boundary where two tectonic plates move away from each other is called:

(a) Convergent boundary

(b) Transform boundary

(c) Divergent boundary

(d) Passive margin

जिस सीमा पर दो प्लेट एक-दूसरे से दूर हटती हैं? उसे क्या कहा जाता है?

(a) अभिसरण सीमा

(b) परिवर्तित सीमा

(c) अपसारी सीमा

(d) निष्क्रिय किनारा

Which of the following is a major cause of volcanic eruptions?

(a) Solar radiation

(b) Movement of tectonic plates

(c) Weathering

(d) Ocean currents

निम्नलिखित में से कौन ज्वालामुखी विस्फोट का प्रमुख कारण है?

(a) सौर विकिरण

(b) विवर्तनिक प्लेटों की गति

(c) अपक्षय

(d) समुद्री धाराएं

(vi) What is the point inside the Earth where an earthquake originates called?

(a) Epicenter

(b) Focus (Hypocenter)

(c) Fault line

(d) Seismic zone

पृथ्वी के अन्दर वह स्थान जहाँ भूकम्प की उत्पत्ति होती है, क्या कहलाता है?

(a) उपकेन्द्र

(b) केन्द्र बिन्दु

(c) अंश रेखा

(d) भूकम्पीय क्षेत्र

(vii) Karst topography is primarily formed due to the action of:

(a) Wind

(b) Glaciers

(c) Groundwater action on limestone

(d) Volcanic activity

कार्स्ट स्थलाकृति मुख्य रूप से निम्नलिखित की क्रिया के कारण बनती है:

(a) पवन

(b) हिमनद

(c) चूना पत्थर पर भूमिगत जल की क्रिया

(d) ज्वालामुखी गतिविधि

(viii) Which of the following is a depositional feature formed by glaciers?

(a) Cirque

(b) Moraine

(c) Arete

(d) U-shaped valley

निम्नलिखित में से कौन-सी स्थलरूपी संरचना हिमनदों द्वारा निक्षेपण के कारण बनती है?

(a) सर्क

(b) मोरेन

(c) एरेट

(d) यू-आकार की घाटी

(ix) Which of the following landforms is commonly found in arid regions?

(a) Cirque

(b) Yardang

(c) Moeraine

(d) Delta

निम्नलिखित में से कौन-सी स्थलाकृति शुष्क क्षेत्रों में पाई जाती है?

(a) सर्क

(b) यारडांग

(c) मोरेन

(d) डेल्टा

(x) A mushroom rock is formed due to:

(a) Glacial erosion

(b) Volcanic activity

(c) Wind erosion

(d) Chemical weathering

मशरूम चट्टान किसके कारण बनती है?

(a) हिमनदी अपरदन

(b) ज्वालामुखी क्रिया

(c) पवन अपरदन

(d) रासायनिक अपक्षय

PART-B / भाग-ब

(Short Answer Type Questions)

(लघु उत्तरीय प्रश्न)

Note: Answer any four questions. Each question carries 5 marks. [4×5=20]

निम्नलिखित में से किन्हीं चार प्रश्नों के उत्तर दीजिए। प्रत्येक प्रश्न 5 अंकों का है।

2. Discuss is briefabout the scope of Geomorphology.

भू-आकृति विज्ञान के क्षेत्र पर संक्षेप में चर्चा कीजिए।

3. Discuss about the convergent plate boundary.

अभिसारी प्लेट सीमा के बारे में चर्चा कीजिए।

4. Write about the different types of volcanoes.

ज्वालामुखियों के विभिन्न प्रकारों के बारे में लिखिए।
5. Write about the difference between the Weathering and Erosion Process.

अपघटन और अपरदन की प्रक्रियाओं में क्या अंतर है? लिखिये।

6. Explain the major landforms created by glacial erosion.

हिमानी अपरदन द्वारा निर्मित प्रमुख स्थलरूपों की व्याख्या कीजिए।

What is isostasy? Discuss the postulates made by Airy or Pratt.

समस्थिति क्या है? एयरी या प्रेट द्वारा दिए गए सिद्धान्तों की चर्चा कीजिए।

PART-C/ भाग-स

(Long Answer Type Questions)

(दीर्घ उत्तरीय प्रश्न)

Note: Answer any three questions. Each question carries 10 marks. [3×10-30]

निम्नलिखित में से किन्हीं तीन प्रश्नों के उत्तर दीजिए। प्रत्येक प्रश्न 10 अंकों का है।
8. Explain the Nebular Hypothesis or Tidal Hypothesis and discuss its importance in understanding the origin of the Earth.

निहारिका सिद्धान्त अथवा ज्वारीय सिद्धान्त की व्याख्या कीजिए तथा पृथ्वी की उत्पत्ति को समझने में इसकी महत्ता पर चर्चा कीजिए।
9. Describe the internal structure of the Earth with the help of a labelled diagram.

पृथ्वी की आन्तरिक संरचना का वर्णन एक चिन्हित आरेख की सहायता से कीजिए।
10. Describe Alfred Wagener’s Continental Drift Theory.

अल्फ्रेड वेगनर के महाद्वीपीय विस्थापन सिद्धान्त का वर्णन कीजिए।
11. Explain the theory of mountain building proposed by Kober or Holmes.

कोबर या होम्स द्वारा प्रस्तुत पर्वत निर्माण सिद्धान्त की व्याख्या कीजिए।
12. Explain the Normal cycle of Erosion as proposed by William Morris Davis.

विलियम मॉरिस डेविस द्वारा प्रतिपादित सामान्य अपरदन चक्र की व्याख्या कीजिए।

17. Nearest Neighbor Analysis (निकटतम पड़ोसी विश्लेषण)

Nearest Neighbor Analysis

(निकटतम पड़ोसी विश्लेषण)


Nearest Neighbor Analysis

परिचय

    निकटतम पड़ोसी विश्लेषण (Nearest Neighbor Analysis) एक प्रकार की स्थानिक सांख्यिकीय तकनीक है जिसका उपयोग भौगोलिक प्रतिरूप, वितरण और दूरी के अध्ययन के लिए किया जाता है।

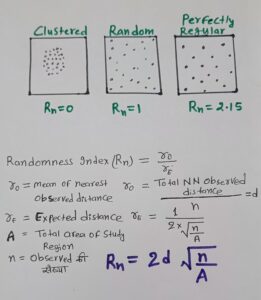
    यह विश्लेषण बताता है कि किसी वस्तु (जैसे कि शहर, पौधे, जीव, अपराध स्थल आदि) का वितरण सांख्यिकीय रूप से समूहित (Clustered), यादृच्छिक (Random) या समान (Regular/Uniform) रूप से फैलाव वाला  है या नहीं।

    भौगोलिक सूचना प्रणाली (GIS) और स्थानिक आंकड़ों के अध्ययन में यह तकनीक अत्यंत महत्वपूर्ण है क्योंकि यह स्थानिक संरचना और प्रतिरूप का वैज्ञानिक मूल्यांकन करने में मदद करती है।

उद्देश्य

    निकटतम पड़ोसी विश्लेषण के मुख्य उद्देश्य निम्नलिखित हैं:

(i) किसी वस्तु का स्थानिक वितरण पैटर्न पहचानना।

(ii) यह जांचना कि क्या वितरण यादृच्छिक, समूहित या समान रूप से फैला है।

(iii) शहरी और ग्रामीण योजना में केंद्रों की उचित व्यवस्था सुनिश्चित करना।

(iv) आर्थिक और पर्यावरणीय अध्ययन में प्राकृतिक संसाधनों के वितरण का विश्लेषण।

(v) आपदा प्रबंधन और आपूर्ति श्रृंखला योजना में उपयोग।

सिद्धांत

     निकटतम पड़ोसी विश्लेषण निम्नलिखित आधार पर कार्य करता है:

⇒ प्रत्येक बिंदु के लिए सबसे नजदीकी पड़ोसी की दूरी मापी जाती है।

⇒ इन दूरी का औसत लिया जाता है।

⇒ इसे यादृच्छिक वितरण से तुलना की जाती है।

⇒ यदि बिंदु बहुत पास-पास हैं तो सामूहिक (Clustered)

⇒ यदि बिंदु असमान हैं तो यादृच्छिक (Random)

⇒ यदि बिंदु एक समान रूप से फैले हैं तो समान (Regular/Uniform)

मुख्य सूत्र:

Rn (Randomness Index) अनुपात निकालना:

Nearest Neighbor Analysis

उपयोग

(i) शहरी योजना: विद्यालय, अस्पताल, बस स्टॉप आदि का स्थानिक वितरण समझने के लिए।

(ii) पर्यावरण अध्ययन: पौधों और जीवों का वितरण।

(iii) अपराध भूगोल: अपराध स्थलों का क्लस्टरिंग पैटर्न पहचानना।

(iv) संसाधन प्रबंधन: जल स्रोत, खनिज आदि का स्थानिक विश्लेषण।

(v) सामाजिक अध्ययन: बाजार, बैंक या अन्य सेवाओं का वितरण।

निष्कर्ष:

     निकटतम पड़ोसी विश्लेषण एक सरल परंतु शक्तिशाली तकनीक है, जो स्थानिक वितरण पैटर्न को समझने और मूल्यांकन करने में मदद करती है। यह शहरी, पर्यावरणीय, आर्थिक और सामाजिक अध्ययन में अत्यंत उपयोगी है। सही डेटा और सॉफ्टवेयर टूल के साथ, यह यादृच्छिक, समूहित और समान वितरण को स्पष्ट रूप से पहचान सकता है और नीति निर्माण और योजना में महत्वपूर्ण योगदान देता है।

16. Regression Analysis (प्रतीगमन या प्रत्यागमन विश्लेषण)

Regression Analysis

(प्रतीगमन या प्रत्यागमन विश्लेषण)


Regression Analysis

परिचय

      ‘प्रतीपगमन’ (Regression) शब्द का अर्थ ‘पीछे लौटना’ अथवा ‘वापस आना’ (to regress or return back) है। इस शब्द का सर्वप्रथम प्रयोग 1877 में सर फ्रांसिस गाल्टन (Sir Francis Galton) ने अपने शोध लेख ‘पैतृक ऊँचाई में मध्यमता की ओर प्रतीपगमन’ (Regression towards mediocrity in hereditary stature) में किया था।

     प्रत्यागमन विश्लेषण (Regression Analysis) सांख्यिकी का एक अत्यंत महत्वपूर्ण विश्लेषणात्मक उपकरण है, जिसका उपयोग दो या दो से अधिक चर (Variables) के बीच संबंधों का अध्ययन करने के लिए किया जाता है। यह न केवल चर के बीच संबंधों की दिशा एवं ताकत को मापता है, बल्कि इस आधार पर भविष्य के मूल्यों का पूर्वानुमान (Prediction) भी करता है। इसीलिए इसे पूर्वानुमान के लिए सबसे प्रभावी सांख्यिकीय विधियों में से एक माना जाता है।

      प्रत्यागमन विश्लेषण मुख्य रूप से निर्भर चर (Dependent Variable) और स्वतंत्र चर (Independent Variable) के बीच संबंधों पर आधारित होता है। उदाहरण के लिए, यदि हम जानना चाहें कि किसी छात्र के परीक्षा-अंक उसकी पढ़ाई के घंटों पर कैसे निर्भर करते हैं, तो हम Regression Analysis का उपयोग करेंगे।

प्रत्यागमन विश्लेषण की परिभाषा     

      “Regression उस सांख्यिकीय तकनीक को कहते हैं जिसके द्वारा दो चर के बीच मात्रात्मक संबंध स्थापित किया जाता है और उसके आधार पर संबंधित चर के मूल्यों का अनुमान लगाया जाता है।”

सक्षेप में-

    Regression वह पद्धति है जिसमें हम एक चर के माध्यम से दूसरे चर के मूल्यों का अनुमान लगाते हैं।

Regression Analysis की आवश्यकता और उपयोगिता

(i) पूर्वानुमान (Prediction):-

          Regression Analysis की आवश्यकता और उपयोगिता पूर्वानुमान में इसलिए है कि यह चर (variables) के बीच संबंध स्थापित कर भविष्य के मानों का अनुमान लगाने, रुझान पहचानने और निर्णय-निर्धारण में सहायता करता है।

    बिक्री, उत्पादन, मांग, तापमान, GDP, जनसंख्या आदि का भविष्य अनुमान लगाने में उपयोगी।

(ii) निर्णय-निर्माण (Decision Making):-

    Regression Analysis की आवश्यकता निर्णय-निर्माण में इसलिए होती है क्योंकि यह भविष्य के रुझानों का अनुमान, चर-परिवर्तनशीलताओं का प्रभाव और नीतिगत या व्यावसायिक विकल्पों की सटीकता को बढ़ाता है।

(iv) चर-संबंधों का अध्ययन:-

  Regression Analysis की आवश्यकता चर-संबंधों को मात्रात्मक रूप से समझने, पूर्वानुमान बनाने, कारण-प्रभाव दिशा पहचानने और विभिन्न स्वतंत्र चरों का आश्रित चर पर प्रभाव मापने में होती है;

(v) प्रत्यक्ष एवं अप्रत्यक्ष प्रभावों की माप

   जैसे- आय का उपभोग पर प्रभाव, शिक्षा का आय पर प्रभाव।

(vi) वैज्ञानिक व सामाजिक अनुसंधान में उपयोग

    मनोविज्ञान, जनसांख्यिकी, भौतिकी, जीवविज्ञान, भूगोल आदि में व्यापक उपयोग।

Regression के प्रकार (Types of Regression Analysis)

1. Simple Regression (सरल प्रत्यागमन)

     जब एक स्वतंत्र चर और एक निर्भर चर के बीच संबंध स्थापित किया जाता है।

उदा.—उपभोग (Y) = f (आय X)

Regression Equation: Y = a+bX

2. Multiple Regression (बहु-प्रत्यागमन)

जब अनेक स्वतंत्र चर किसी एक निर्भर चर को प्रभावित करते हैं।

उदा.- आय (Y) = शिक्षा (X₁) + अनुभव (X₂) + कौशल (X₃)

Equation: Y=a+b1X1+b2X2+b3X3…….

3. Linear Regression (रेखीय प्रत्यागमन)

    जहाँ निर्भर चर और स्वतंत्र चर के बीच संबंध सीधी रेखा के रूप में हो।

Y = a+bX

Regression Line (प्रत्यागमन रेखा)

    Regression Analysis का मुख्य उद्देश्य एक ऐसी रेखा खोजना होता है जो स्वतंत्र चर और निर्भर चर के बीच न्यूनतम त्रुटि (Minimum Error) के साथ संबंध दर्शाए।

Regression Coefficient (प्रत्यागमन गुणांक)

     Regression coefficient (b) यह बताता है कि स्वतंत्र चर में एक इकाई परिवर्तन होने पर निर्भर चर में कितना परिवर्तन होगा।

उदाहरण:

यदि b = 0.8

तो X में 1 इकाई वृद्धि होने पर Y में 0.8 इकाई वृद्धि होगी।

Regression coefficient के गुण:

⇒ b का मान धनात्मक (+) या ऋणात्मक (–) दोनों हो सकता है।

⇒ b = 0 मतलब दोनों चरों में कोई संबंध नहीं।

⇒ यदि दोनों b (bxy और byx) धनात्मक हों = सीधा संबंध।

⇒ यदि दोनों b ऋणात्मक हों = व्युत्क्रम संबंध।

Regression Analysis का एक सरल उदाहरण

        मान लीजिए किसी छात्र ने पढ़ाई (X) के घंटे और परीक्षा-अंक (Y) का विवरण दिया:

X (घंटे) Y (अंक)
2 40
3 50
4 60
5 70

Regression Equation:

Y=a+bX

यदि गणना से प्राप्त हो:

a = 20, b = 10

तो समीकरण होगा:

Y = 20+10X

यदि X = 6 घंटे पढ़ाई →

Y = 20+10(6)=80

अर्थात छात्र अनुमानतः 80 अंक प्राप्त करेगा।

Correlation और Regression में अंतर

बिंदु Correlation Regression
उद्देश्य संबंध मापना पूर्वानुमान करना
संबंध दिशा केवल दिशा/मजबूती बताता है आश्रित व स्वतंत्र का संबंध बताता है
Variables कोई dependent नहीं Y dependent, X independent
मान सीमा -1 से +1 कोई भी मान
परिणाम r (सहसंबंध गुणांक) Y = a + bX (प्रतिगमन समीकरण)
उपयोग संबंध की मजबूती Prediction (पूर्वानुमान)
निष्कर्ष

     प्रत्यागमन विश्लेषण एक अत्यंत प्रभावी एवं वैज्ञानिक सांख्यिकीय तकनीक है जो विभिन्न क्षेत्रों में भविष्य के अनुमान लगाने, संबंधों को समझने और निर्णय लेने में महत्वपूर्ण भूमिका निभाती है। यह केवल दो चरों के बीच संबंधों का मात्रात्मक विश्लेषण ही नहीं करता, बल्कि इसके आधार पर व्यावहारिक समाधान भी प्रदान करता है।

   सटीक एवं विश्वसनीय आंकड़ों के साथ उपयोग करने पर Regression Analysis शोध, अर्थव्यवस्था, विज्ञान, समाजशास्त्र, नीति-निर्माण और व्यावसायिक क्षेत्रों में अत्यंत उपयोगी सिद्ध होता है।

नोट:  गाल्टन ने लगभग एक सहस्र पिताओं तथा पुत्रो की ऊँचाइयों का अन्वेषण करके यह ज्ञात किया कि “लम्बे पिताओं के पुत्र भी लम्बे होते है, तथा छोटे पिताओं के पुत्र भी छोटे होते हैं, परन्तु लम्बे पिताओं के पुत्री की औसत ऊँचाई उनके पिताओं की ऊँचाई की औसत से कम होती है तथा छोटे पिताओं के पुत्रों की औसत ऊँचाई उनके पिताओं की ऊँचाई की औसत से अधिक होती है।”

     गाल्टन ने मानव जाति में सामान्य ऊँचाई (normal height) की ओर लौटने की प्रवृत्ति को प्रतीपगमन को संज्ञा दी है।


उत्तर लिखने का दूसरा तरीका


Regression Analysis

Introduction:

     The mutual relationship between two Series is measured with the help of Correlation. Under correlation the direction and magnitude of the relationship between two variables is measured. But it is not possible to make the best estimate of the value of a dependent Variable on the basis of the given value of the Independent Variable by correlation analysis.

     Therefor, to make the best estimates and future estimation, the Study of regression analysis is very Important useful.

Meaning:

     Regression is the Study of the nature of relationship between that one may be able to Predict the Unknown value of one variable for a known value of another Variable.

     In regression, one variable is considered as an independent Variable and another Variable is taken as dependent Variable. with the help of regression, possible values of the dependent Variable are estimated on the basis of values of the independent variable.

     for example demand and price.

On the basis of this relationship between demand and price probable Value of demand can be estimated Corresponding to the different Values of place.

⇒ Regression Analysis is the technique for measuring or estimating the relationship among Variables.

⇒ Regression Analysis provides estimates of Values of the dependent Variable From the Values of the independent Variable.

⇒ The device used to accomplish this estimation procedure is the regression line.

⇒ The regression line describes the average relationship existing between x and y.

Exmple-

x y
4 100
7 92
15 90
18 82
20 79
25 74
28 68
. .
. .
35 ?    (here, x given, y=?)
. .
. .
?  (here, y given, x=?) 20

Difference Between Correlation and Regression

Correlation Analysis Regression Analysis
1. Correlation coefficient  is a measure of degree of covariability between x and y. 1. Objective of regression analysis is to Study the nature of relationship between Variables.
2. In Correlation analysis we can not say that one Variable is the cause & other the effect. 2. in regression analysis it is possible to study Cause & effect relationship.
3. In Correlation analysis both rxy & ryx are Symmetric (rxy=ryx) 3. In regression analysis bxy & byx are not Symmetric. (bxy≠byx)
4. There may be measure Correlation which has no practical relevance such as Increase in income & increase in weight. 4. There is nothing like non-Sense regression.
5. Correlation coeff. is independent of change of scale and origin.  5. Regression coefficientsare independent of change of origin but not of scale.

Similarity: Correlation coeff. (r) and regression coeff. (bxy & byx always have Same Sign.

UTILITY OF REGRESSION

(i) Nature of Relationship:-

    Regression analysis explains the nature of relationship between two variables.

(ii) Estimation of Relationship:-

     The mutual relationship between two or more variables can be measured easily by regression analysis.

(iii) Prediction:-

      By regression analysis, the value of a dependent variable can be predicted on the basis of the value of an independent variable. For example, if the price of a commodity rises, what will be the probable fall in demand, this can be predicted by regression.

(iv) Useful in Economic and Business research:-

    Regression analysis is very useful in business and economic research. With the help of regression, business and economic policies can be formulated.

TYPES OF REGRESSION ANALYSIS

1. Simple and Multiple Regression:-

      In simple regression analysis, we study only two variables at the time, in which one variable is dependent and another is independent. For example income and expenditure.

      on the contrary, we study more than two variables at a time in multiple, regression analysis in which one is dependent variable and others are independent variable. For example the study of rain and irrigation, the study of effect of rain and irrigation on yield of wheat.

2. Linear and Non-Linear Regression:-

    when one variable changes with other variable in some fixed ratio, this is called linear regression. such type of relationship is depicted on a graph by means of straight line.

    On the other hand when one variable varies with other variable in a changing ratio, then it is referred to as curvi-linear or Non-linear regression. This relationship, expressed on a graph paper takes the form of curve.

3. Partial and Total Regression:-

     When two or more variables are studied for functional relationship but at a time relationship between only two variables is studied and other variables held constant then it is known as partial regression. On the other hand, in total regression all variables are studied simultaneous for the relationship among them.

Simple Linear Regression

Regression lines:

     Regression lines are linear equations that show the relationship between two variables. These help in making predictions, understanding trends and determining the direction of changes in the data.

Regression lines
Regression line of y on x Regression line of x on y
1. y-ȳ = byx (x-x̄)

byx is regression coeff. of y on x

byx =

1. x-x̄ = bxy (y-ȳ)

bxy is regression coeff. of x on y

bxy =

Both lines intersect at point (x̄, ȳ),  x̄ = Mean of x, ȳ = Mean of y
2. x→ Independent variable

y→ Dependent variable

2. x→Dependent variable

y→ Independent variable

3. Used to calculate y for given x 3. Used to calculate y for given y
4. Regression equation of y on x, y = a+bx 4. Regression equation of x on y, x = a+by

Methods of Obtaining Regression Lines

(i) Scatter Diagram Method:-

      This is the simplest method of constructing regression lines, In this method, values of the related variables are plotted on a graph. A straight line is drawn passing through the plotted points. The straight line is drawn with free hand. This shape of regression line can be linear or non-linear also. This depends upon the location of plotted points. This method is very rarely used in practicle because in this method, the decision of the person who draws the regression lines very much affects the result.

(ii) Least Square Method:-

    Regression lines are also constructed by least Square method. Under this method, the two regression lines, is fitted through different points in such a way that the sum of squares of the deviations of the observed values from the fitted line shall be least. The line drawn by this method is called the Line of Best Fit. In other words, regression line of Y on X is so drawn such that vertically, the sum of squared deviation becomes minimum relating to the different points and the regression line on X on Y is so drawn such that horizontally, squared deviations of different points add up to minimum.

Regression Lines

and

Degree of Correlation

REGRESSION EQUATIONS

   Regression equations are the algebraic formulation of regression lines. Regression equations present Regression lines.

(i) Regression equation of x on y

     This equation is used to estimate the probable value of x on the basis of the given value of y.

⇒ x-x̄ = bxy (y-ȳ)

(ii) Regression Equation of y on x

     This equation is used to estimate the probable value of y on the basis of given value of x.

⇒ y-ȳ = byx (x-x̄)

REGRESSION COEFFICIENTS

    Regression Coefficient measures the average change in the value of one variable for a unit change in the value of another variable. r Infact, it represents the slope of a regression line.

(i) Regression Coefficient x on y

     This Coefficient shows that with the unit change in the value of y variable, what will be the average change in the value of x variable.

bxy = r . σx/σy

(ii) Regression coefficient of y on x

    This Coefficient shows that with a unit change in the value of x variable, what will be the average change in the value of y variable.

byx = r . σy/σx

Example (i) Find both regression lines (x on y and y on x) for the following data.

x y
6 9
2 11
10 5
4 8
8 7

Calculation:

x y x2 y2 xy
6 9 36 81 54
2 11 4 121 22
10 5 100 25 50
4 8 16 64 32
8 7 64 49 56
30 40 220 340 214

n = 5

x̄ = Σx/n = 30/5 = 6

ȳ = Σy/n = 40/5 = 8

byx =

= 5×214 – 30×40 / 5×220 – 30×30

= -0.65

bxy =

= 5×214 – 30×40 / 5×340 – 40×40

= -1.3

now,

x on y ⇒ x-x̄ = bxy (y-ȳ)

⇒ x-6 = -1.3(y-8)

⇒ x-6 = -1.3y + 1.3×8

⇒ x = -1.3y + 10.4 + 6

⇒ x = -1.3y + 16.4

y on x ⇒ y-ȳ = byx (x-x̄)

⇒ y-8 = -0.65 (x-6)

⇒ y-8 = -0.65x + 0.65×6

⇒ y = -0.65x + 3.9+8

⇒ y = -0.65x + 11.9

Example (ii) From the following data:

(a) Obtain two regression lines

(b) Calculate correlation coeff.

(c) Estimate the value of y for x = 6.2

x y
1 9
2 8
3 10
4 12
5 11
6 13
7 14
8 16
9 15

Calculation:

(a) Obtain two regression lines

Note: x on y ⇒ x-x̄ = bxy (y-ȳ)

y on x ⇒ y-ȳ = byx (x-x̄)

(i) For direct method 

We’ll need ⇒ x̄, ȳ, bxy, byx

r =

bxy =

byx =

Finally we’ll need ⇒ n, Σx, Σy, Σx2, Σy2, Σxy 

(ii) For Short-cut method :-

       समानान्तर माध्य की संख्या पूर्णांक में हो तो प्रत्यक्ष रीति द्वारा प्रतीपगमन गुणांक सरलता से प्राप्त किये जा सकते हैं, लेकिन यदि ये माध्य पूर्णांक में नहीं आये तब लघु रीति अपनाना अधिक उपयुक्त होगा। इस रीति में अग्र सूत्रों की सहायता से प्रतीपगमन गुणांकों की गणना की जाती है:

Note: x→ dx = x-A,

y→ dy = y-B

x y d

(x-5)

dy

(y-12)

dx2  dy2 dx dy
1 9 -4 -3 16 9 12
2 8 -3 -4 9 16 12
3 10 -2 -2 4 4 4
4 12 -1 0 1 0 0
5 (A) 11 (B) 0 -1 0 1 0
6 13 1 1 1 1 1
7 14 2 2 4 4 4
8 16 3 4 9 16 12
9 15 4 3 16 9 12
45 108 0 0 60 60 57

Regression Co-efficient of X on Y

bxy = 9(57) – 0(0) / 9(60) – (0)2 

        = 0.95

Regression Co-efficient of Y on X

byx = 9(57) – 0(0) / 9(60) – (0)2

        = 0.95

x̄ = Σx/n = 45/9 = 5

ȳ = Σy/n = 108/9 = 12

now,

x on y ⇒ x-x̄ = bxy (y-ȳ)

⇒ x – 5 = 0.95(y-12)

⇒ x – 5 = (0.95)y – 0.95(12)

⇒ x = (0.95)y – 11.4 + 5

⇒ x = (0.95)y – 6.4

y on x ⇒ y-ȳ = byx (x-x̄)

⇒ y – 12 = 0.95(x – 5)

⇒ y – 12 = (0.95)x – 0.95 (5)

⇒ y – 12 = (0.95)x – 4.75

⇒ y = (0.95)x – 4.75 + 12

⇒ y = (0.95)x + 7.25

(b) Calculate correlation coeff.

(c) Estimate the value of y for x = 6.2

y on x ⇒ y-ȳ = byx (x-x̄)

⇒ y = (0.95)x + 7.25

⇒ y = (0.95)6.2 + 7.25

⇒ y = 5.89 + 7.25

⇒ y = 13.14

error: